


 该文探讨了在经济数据不稳定性下如何评估和增强模型的预测效能,强调了在参数不稳定性情况下,不应仅测试模型参数,而应关注预测能力的鲁棒性评估。文章提供了Matlab代码示例来展示数据处理和预测分析过程,并指出局部性能指标对于衡量模型预测效果的重要性。
👨🎓个人主页:研学社的博客
💥💥💞💞欢迎来到本博客❤️❤️💥💥
🏆博主优势:🌞🌞🌞博客内容尽量做到思维缜密,逻辑清晰,为了方便读者。
⛳️座右铭:行百里者,半于九十。
📋📋📋本文目录如下:🎁🎁🎁
目录

💥1 概述
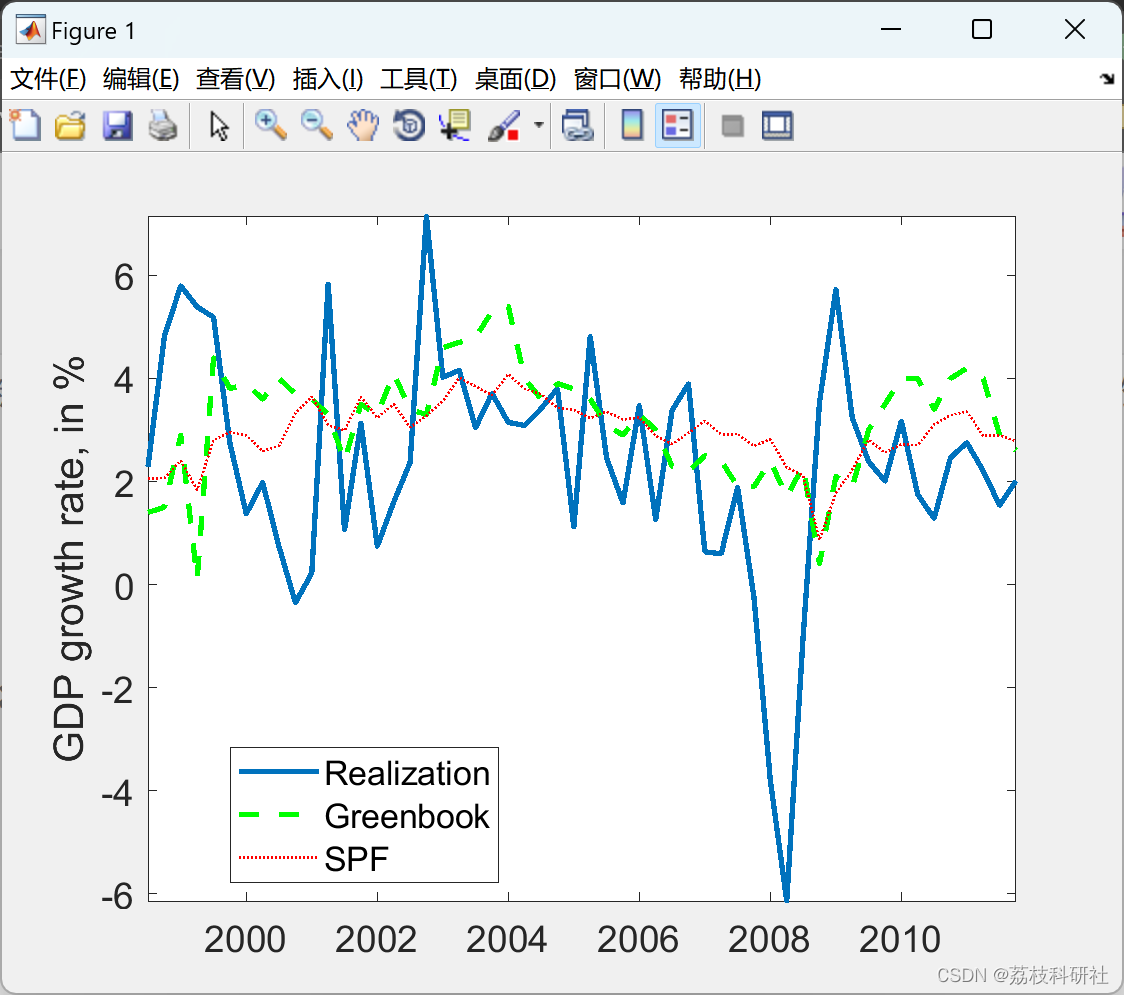
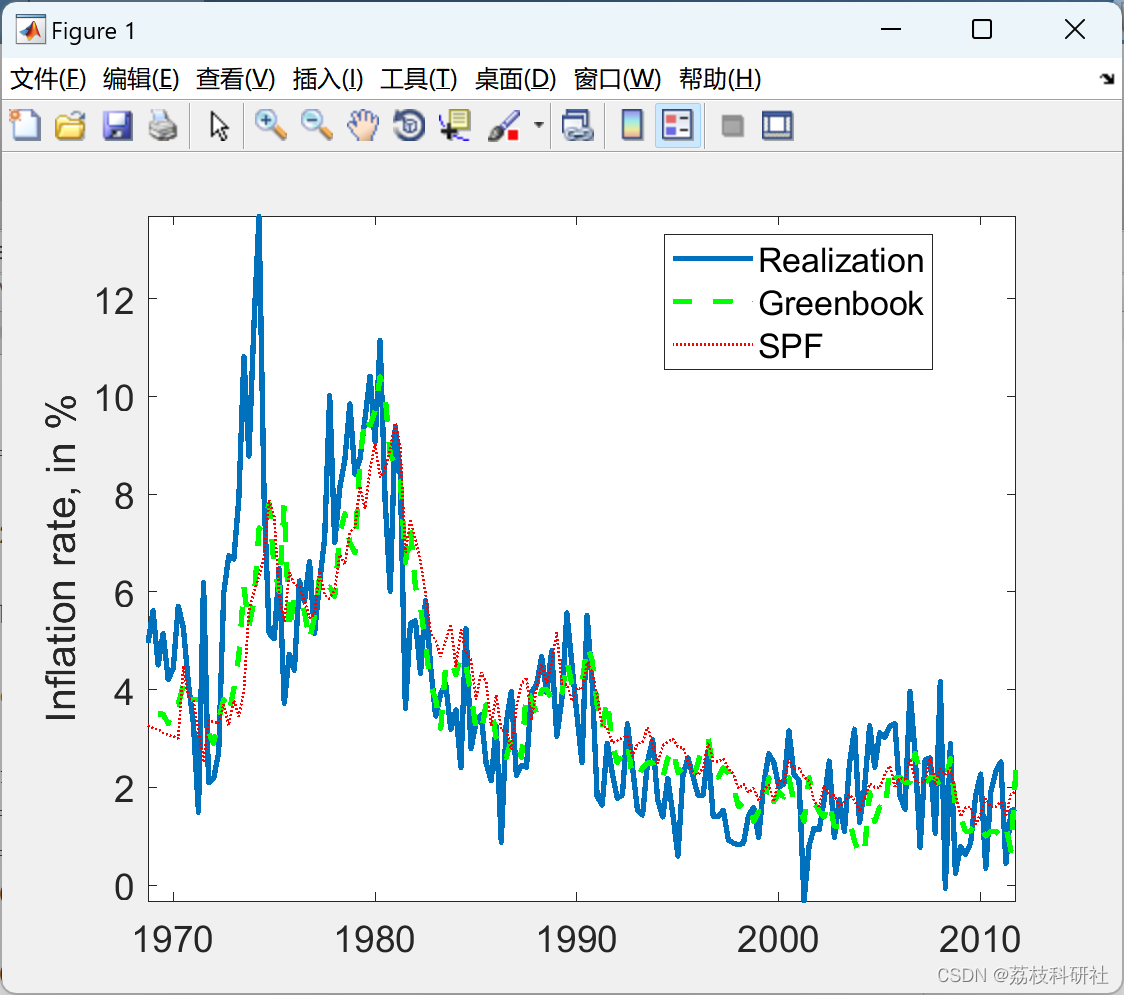
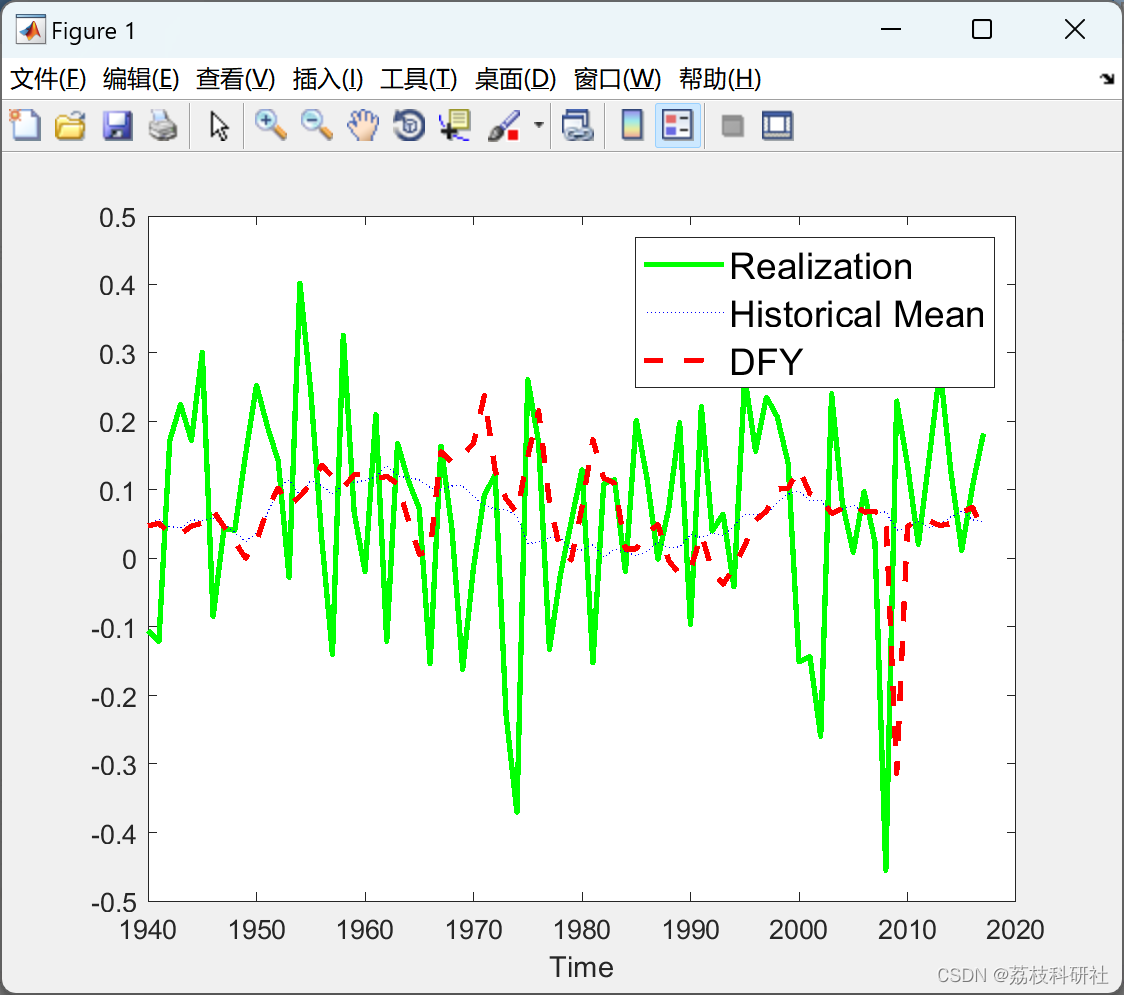
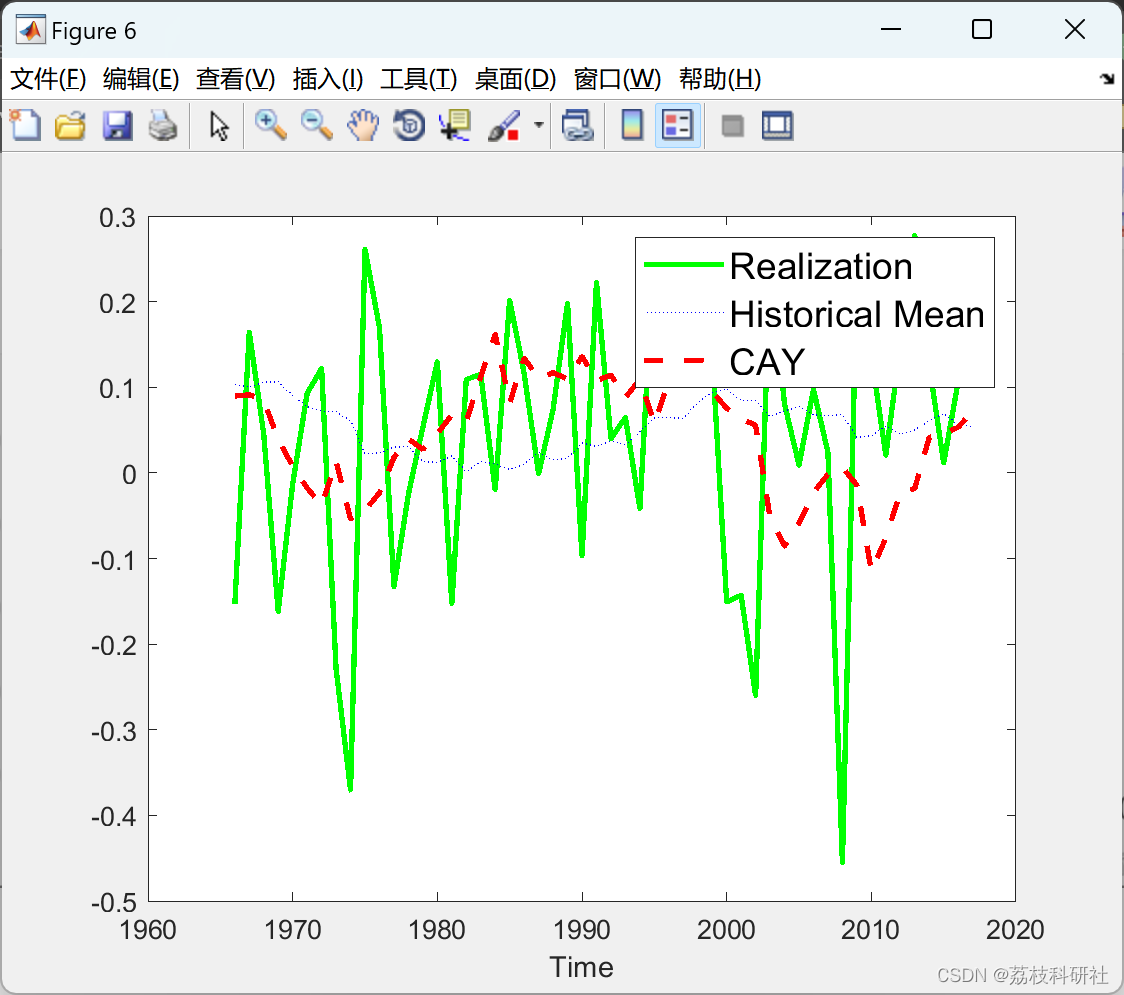
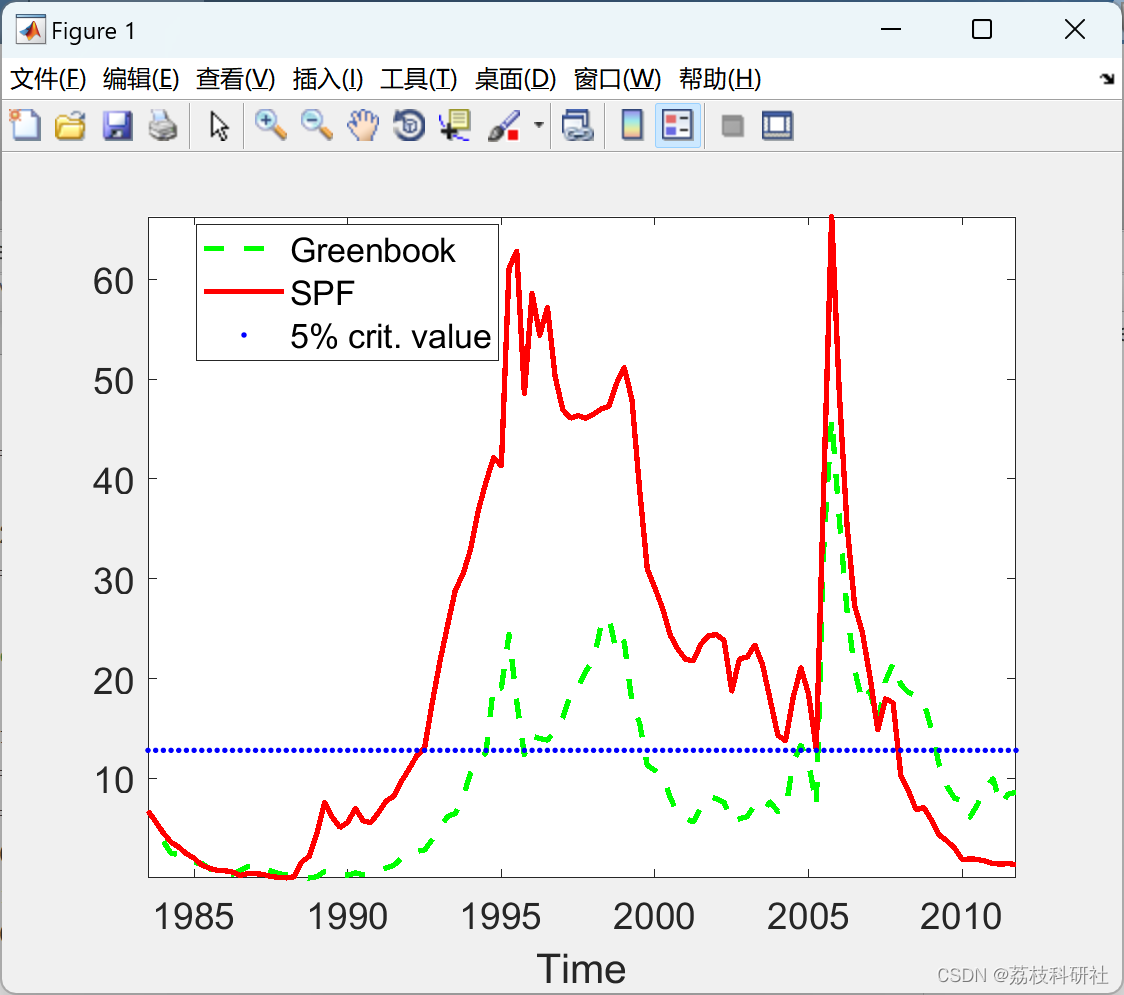
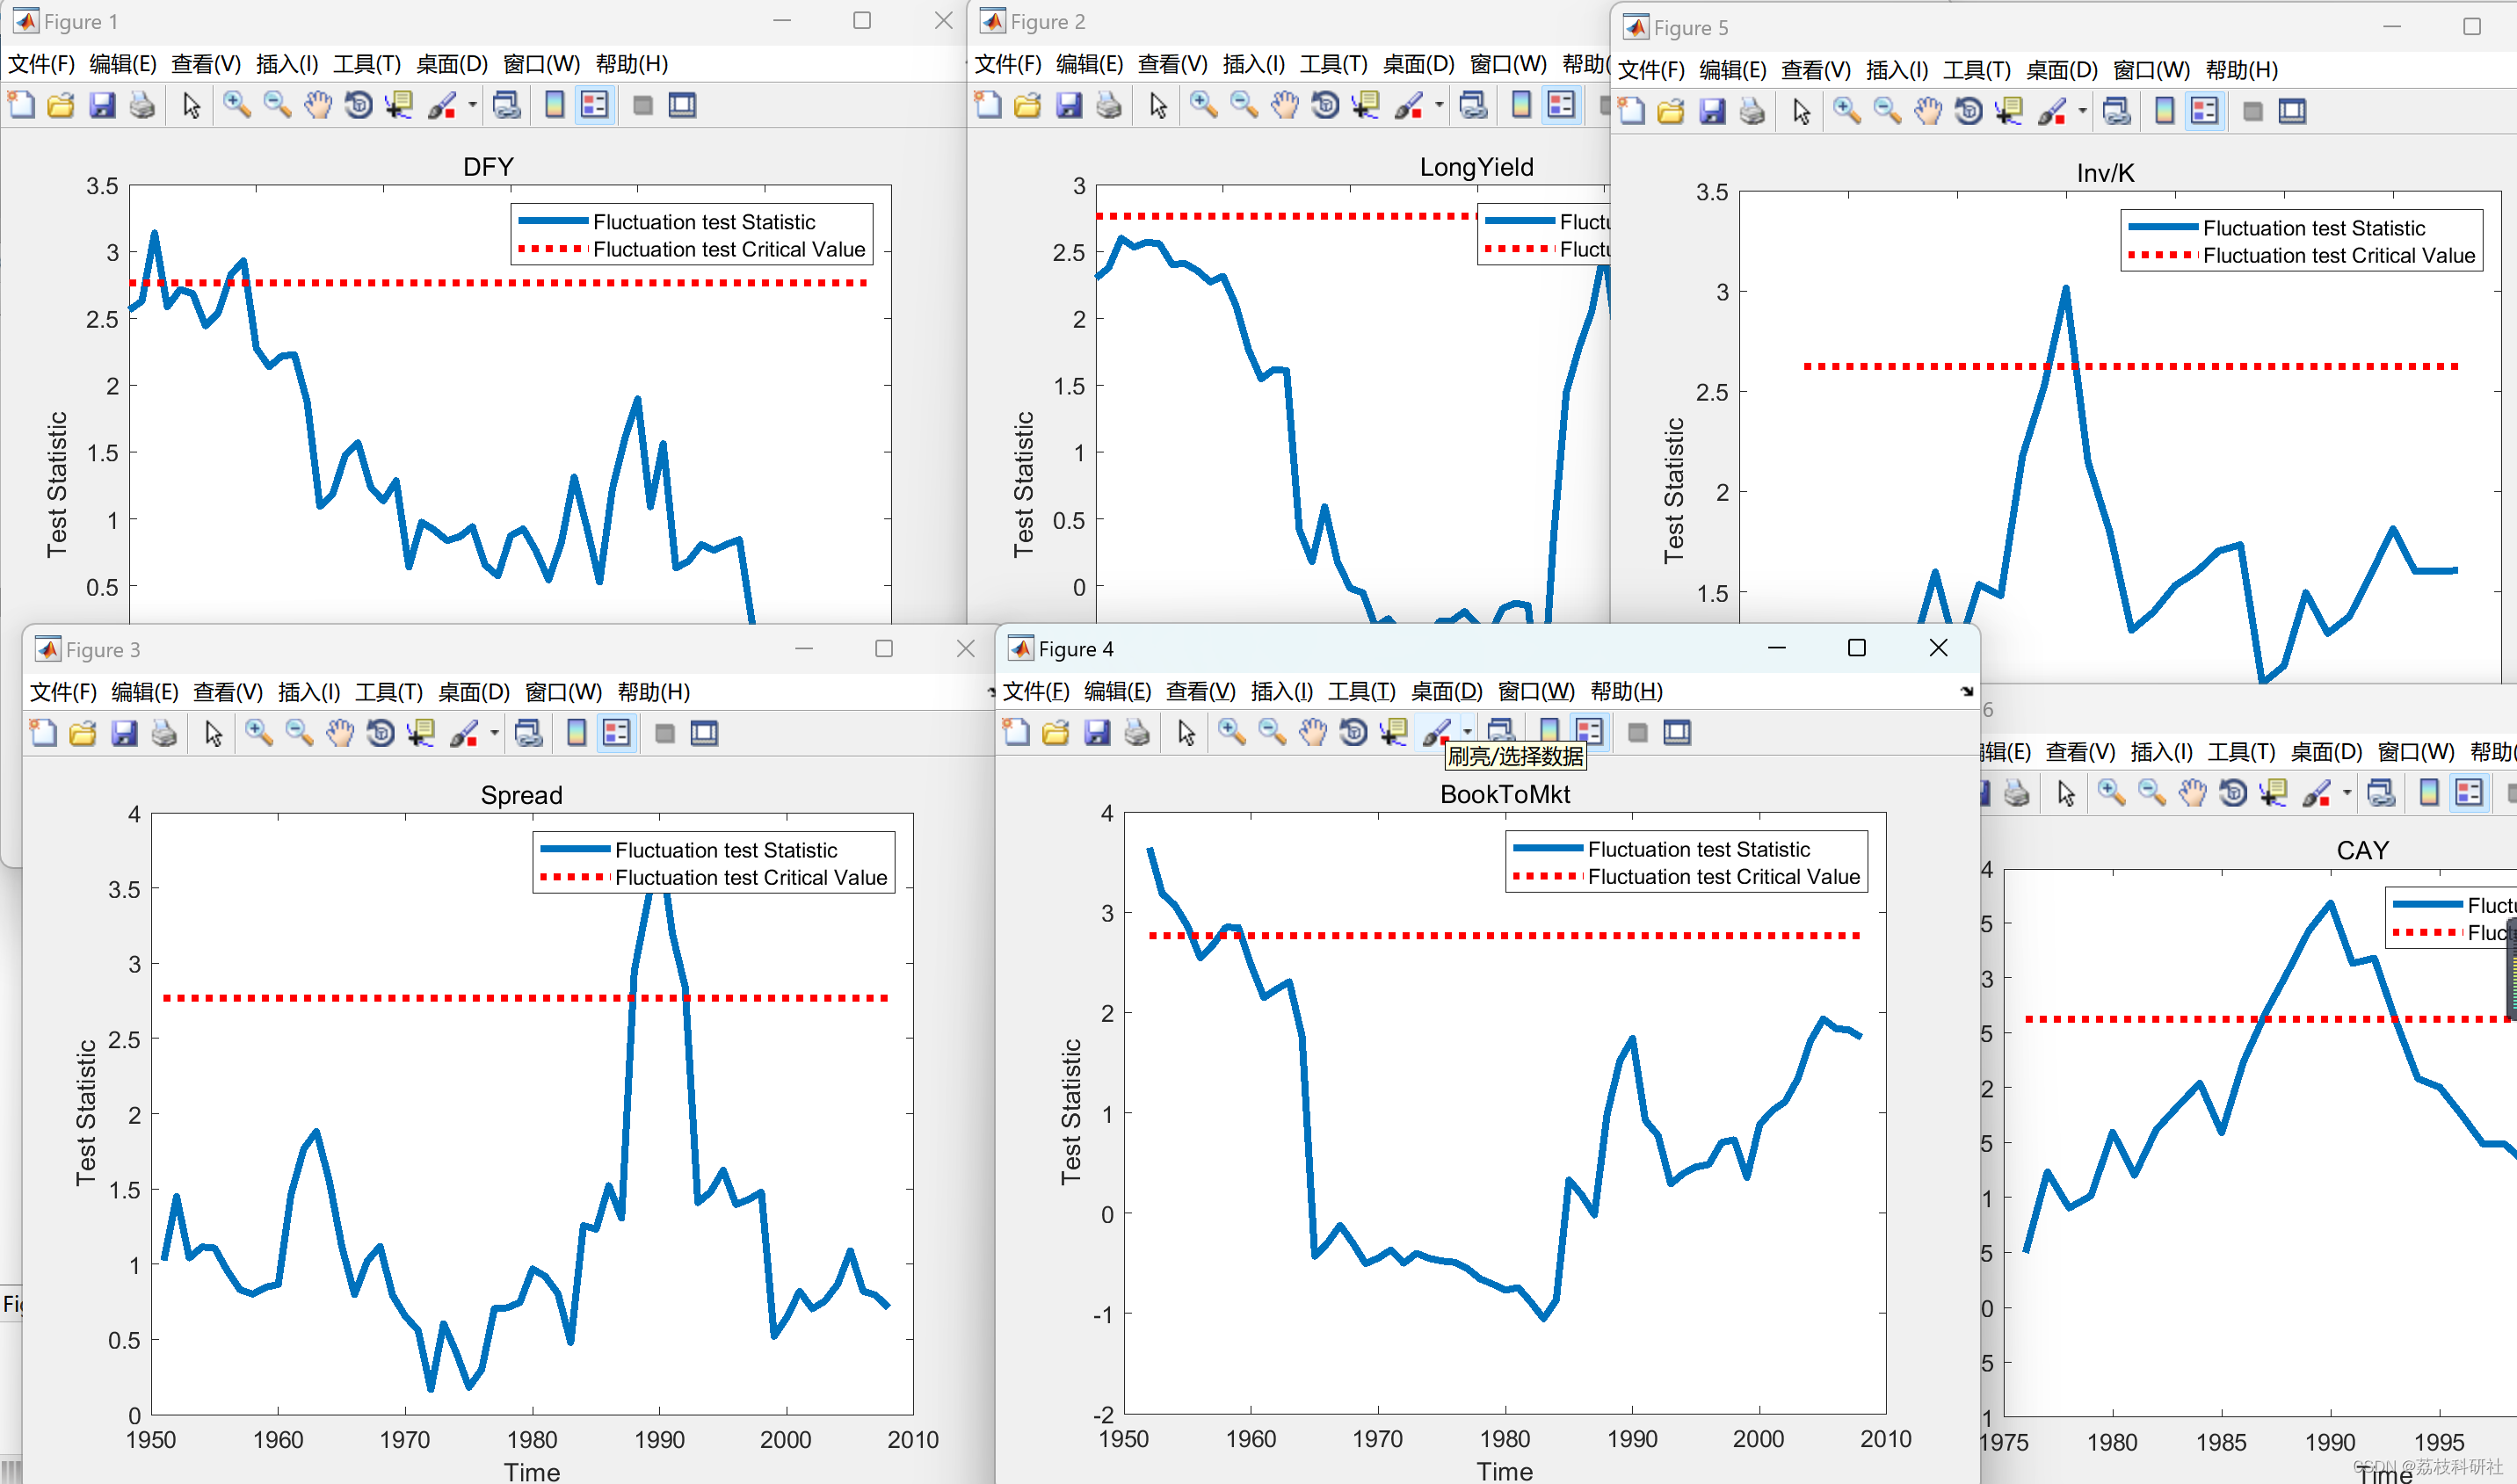
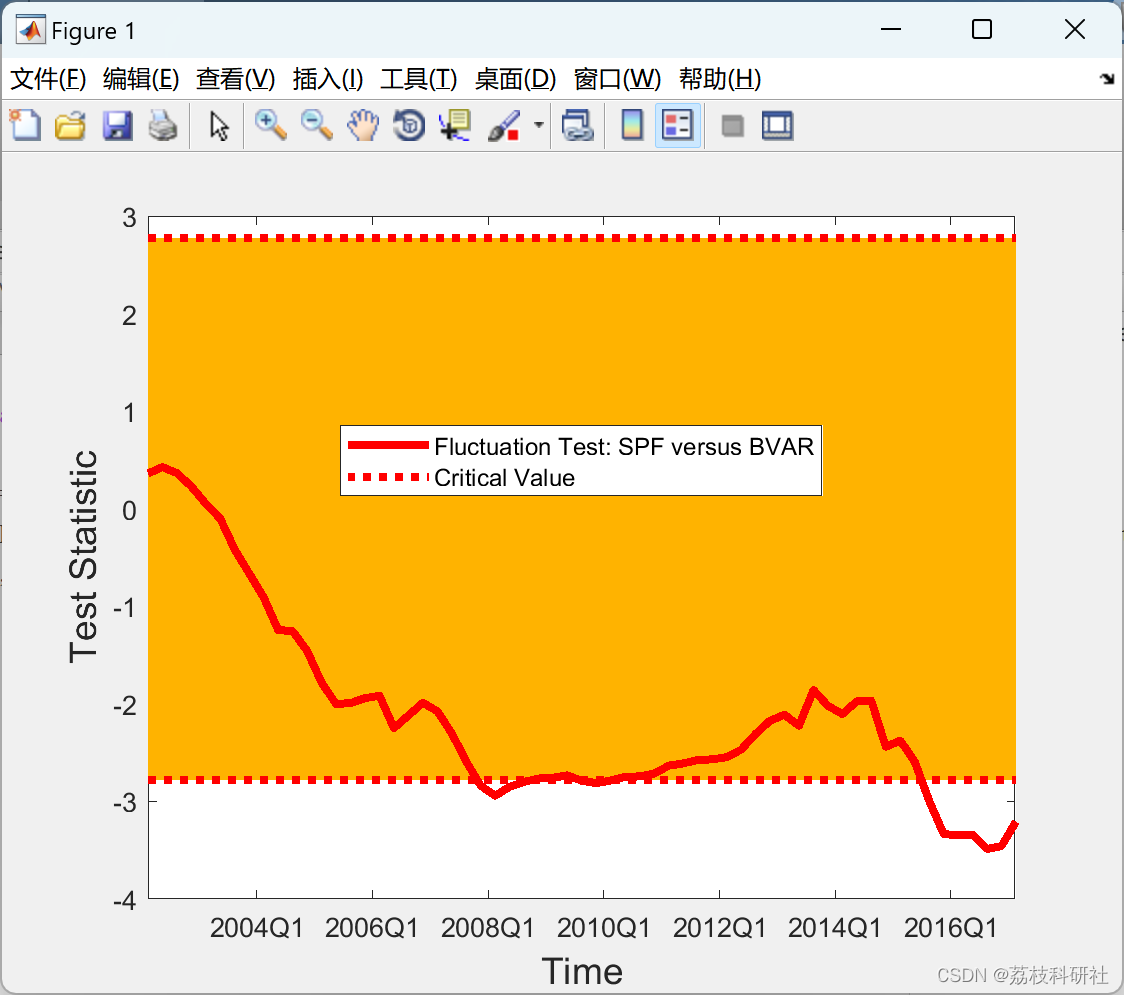
本文就如何在经济时间序列中普遍存在的不稳定性的情况下评估和提高模型的预测能力提供指导。经验相关 例子包括预测2007-08年的金融危机,以及更广泛地说,资产价格、汇率、产出增长和通货膨胀的波动。在不稳定的背景下 环境,我讨论如何评估模型的预测能力;如何对模型的估计进行鲁棒化;以及如何正确报告预测不确定性的度量。重要的是,也许 令人惊讶的是,模型参数的中断既不是必需的,也不足以在模型的预测性能中产生时间变化:因此,不应测试模型的中断 参数,而是以鲁棒的方式评估其预测能力。此外,模型预测性能的局部度量比传统的平均度量更合适。
文献来源:
📚2 运行结果
...
 部分代码:
部分代码:
clear all; close all; clc
strategy = 'abs';
variables = {'GDP', 'Inflation'};
varnum = 1;
variable = variables{varnum};
% Load data
[A,B] = xlsread(sprintf('../data/DataExtended_%s.xlsx', strategy), variable);
transf = A(1,2:end);
data = A(2:end,2:end);
date = A(2:end,1);
h = (0:1:(transf(:,end)));
T = size(data,1);
R = 60;
pdate = [1968.75:0.25:2011.75]';
ptruncdate = NaN(h(1,end)+1,3,T-R+1);
resultstoplot = NaN(h(1,end)+1,3,T-R+1);
critvalues = NaN(h(1,end)+1,3);
table = [];
i = 4;
seldata = data(:,ismember(transf,(i-1)));
%JEL figure for recession
fn = figure;
plot(pdate(120:end),seldata(120:end,1), 'LineWidth',2)
hold on
plot(pdate(120:end),seldata(120:end,2), '--g', 'LineWidth',2)
hold on
plot(pdate(120:end),seldata(120:end,4), ':r', 'LineWidth',1)
legend('Realization','Greenbook','SPF','Location','best')
ylabel('GDP growth rate, in %');
set(findall(gcf,'Type','axes'),'FontSize',14)
axis tight
saveas(gcf,'../results/Figure1.png');
hold off
🎉3 参考文献
部分理论来源于网络,如有侵权请联系删除。
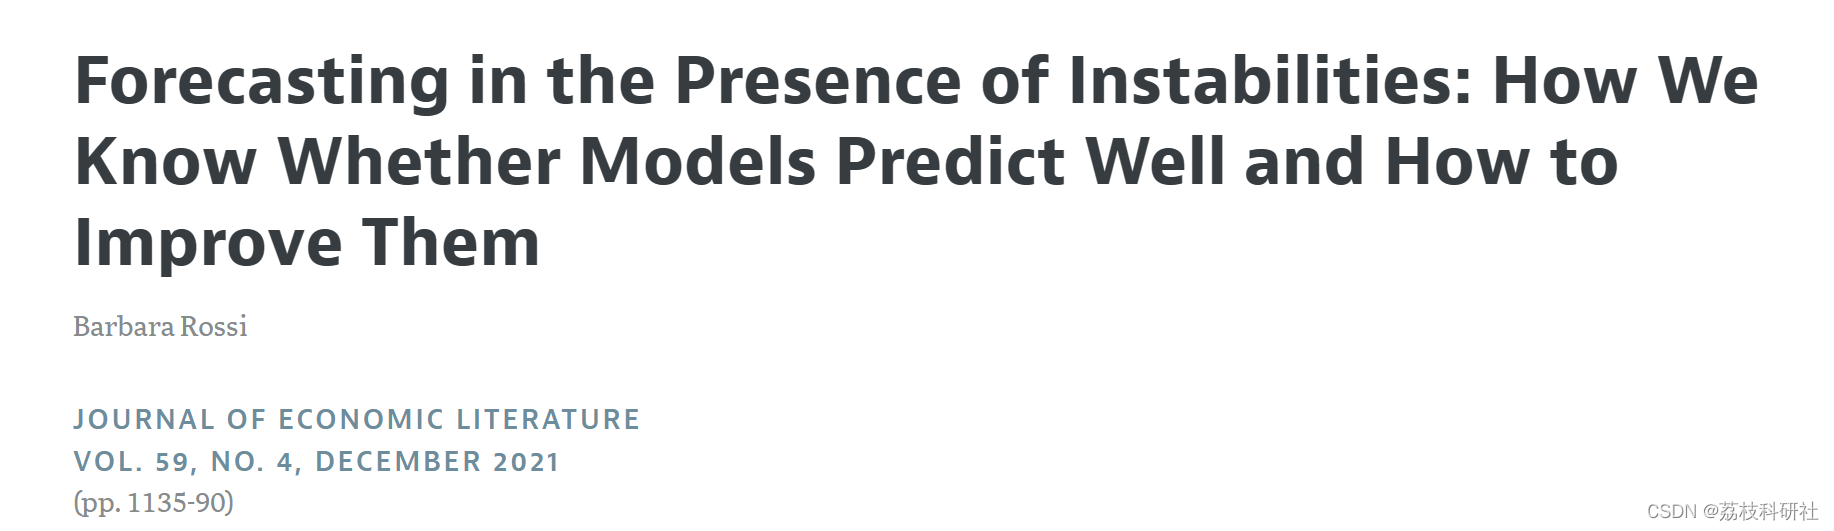
[1]Rossi, Barbara. 2021. "Forecasting in the Presence of Instabilities: How We Know Whether Models Predict Well and How to Improve Them." Journal of Economic Literature, 59 (4): 1135-90.


 377
377

 被折叠的 条评论
为什么被折叠?
被折叠的 条评论
为什么被折叠?
 到【灌水乐园】发言


