


 本文通过Python的NumPy和Matplotlib库实现了一个数学模型,该模型计算了两个角度θ1和θ2随输入变量的变化情况,并将这些角度的变化趋势以图表的形式展现出来。文章详细展示了如何设置坐标轴范围、添加图例等图表美化步骤。
import numpy as np
import matplotlib.pyplot as plt
import math
plt.figure(figsize=(8,4))
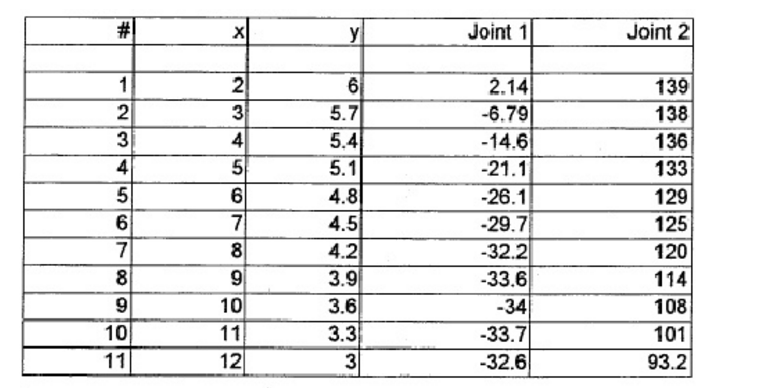
x = np.arange(2,12.1,1)
y = -0.3*x+6.6
cos = (x**2+y**2)/162-1
theta2_rad = [math.acos(s) for s in cos]
theta2=[ x*180/3.14 for x in theta2_rad]
#print(theta2)
#求 theta2
#在接下来的的程序里,例如反三角函数 用到的theta2值是弧度制的,所以要进行转换
theta2_rad = [math.acos(s) for s in cos]
cos1 = np.array([math.cos(s)+1 for s in theta2_rad])
sin1 = np.array([math.sin(s) for s in theta2_rad])
cos2 = np.array([18*(math.cos(s)+1) for s in theta2_rad])
y1 = np.array(y)
x1 = np.array(x)
sin = (y1*cos1-sin1*x1)/cos2
sin = list(sin)
theta1= [(math.asin(s))*180/3.14 for s in sin]
print(theta1)
#画图
t = np.arange(1,12,1)
theta1 =np.array(theta1)
theta2 =np.array(theta2)
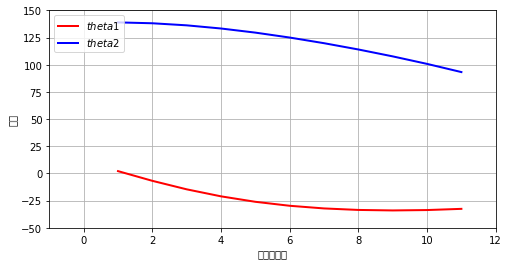
plt.plot(t,theta1,label="$theta1$",color="red",linewidth=2)
plt.plot(t,theta2,label="$theta2$",color="blue",linewidth=2)
plt.ylim(-50,150)
plt.xlim(-1,12)
plt.xlabel("划分的段数")
plt.ylabel("角度")
plt.legend(loc="upper left")
plt.grid(True)
plt.show()
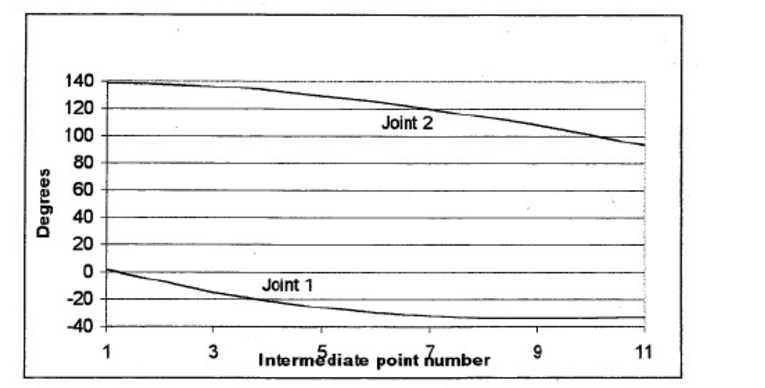
生成的图像:


 863
863

 被折叠的 条评论
为什么被折叠?
被折叠的 条评论
为什么被折叠?
 到【灌水乐园】发言


