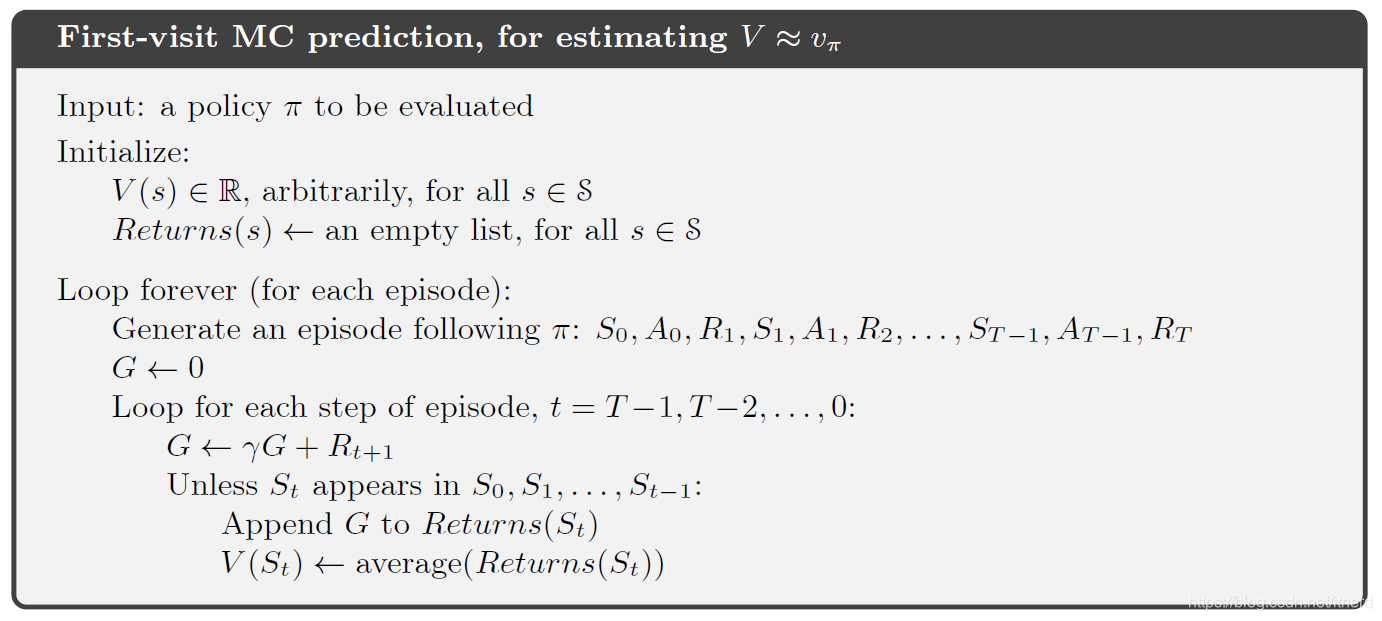
在未知环境的条件下,通过反复模拟获得样本数据,近似估计给定策略下的价值函数 vπv_{\pi}vπ

import gym
import numpy as np
from matplotlib import pyplot
import matplotlib.pyplot as plt
from mpl_toolkits.mplot3d import Axes3D
from collections import defaultdict
from functools import partial
plt.style.use('ggplot')

env = gym.make('Blackjack-v0')

def sample_policy(observation):
    score, dealer_score, usable_ace = observation
    return 0 if score >= 20 else 1

def generate_episode(policy, env):

    # we initialize the list for storing states, actions, and rewards
    states, actions, rewards = [], [], []

    # Initialize the gym environment
    observation = env.reset()

    while True:

        # append the states to the states list
        states.append(observation)

        # now, we select an action using our sample_policy function and append the action to actions list

        action = sample_policy(observation)
        actions.append(action)

        # We perform the action in the environment according to our sample_policy, move to the next state
        # and receive reward
        observation, reward, done, info = env.step(action)
        rewards.append(reward)

        # Break if the state is a terminal state
        if done:
             break

    return states, actions, rewards

def first_visit_mc_prediction(policy, env, n_episodes):

    # First, we initialize the empty value table as a dictionary for storing the values of each state
    value_table = defaultdict(float)
    N = defaultdict(int)


    for _ in range(n_episodes):

        # Next, we generate the epsiode and store the states and rewards
        states, _, rewards = generate_episode(policy, env)
        returns = 0

        # Then for each step, we store the rewards to a variable R and states to S, and we calculate
        # returns as a sum of rewards

        for t in range(len(states) - 1, -1, -1):
            R = rewards[t]
            S = states[t]

            returns += R

            # Now to perform first visit MC, we check if the episode is visited for the first time, if yes,
            # we simply take the average of returns and assign the value of the state as an average of returns

            if S not in states[:t]:
                N[S] += 1
                value_table[S] += (returns - value_table[S]) / N[S]

    return value_table

value = first_visit_mc_prediction(sample_policy, env, n_episodes=500000)
for i in range(10):
	print(value.popitem())
((4, 1, False), -0.5786802030456852)
((14, 1, True), -0.43960396039603966)
((4, 9, False), -0.42211055276381915)
((13, 3, True), -0.22764227642276424)
((7, 3, False), -0.5780911062906736)
((12, 1, True), -0.4090909090909092)
((15, 8, True), -0.2540983606557379)
((4, 3, False), -0.534246575342466)
((4, 2, False), -0.48458149779735665)
((4, 8, False), -0.4603174603174603)
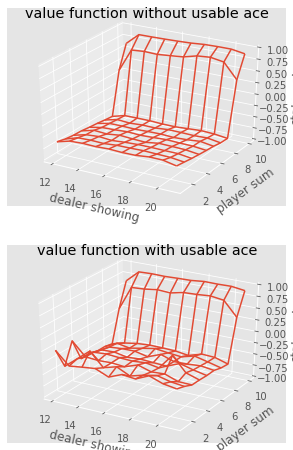
def plot_blackjack(V, ax1, ax2):
    player_sum = np.arange(12, 21 + 1)
    dealer_show = np.arange(1, 10 + 1)
    usable_ace = np.array([False, True])
    state_values = np.zeros((len(player_sum), len(dealer_show), len(usable_ace)))

    for i, player in enumerate(player_sum):
        for j, dealer in enumerate(dealer_show):
            for k, ace in enumerate(usable_ace):
                state_values[i, j, k] = V[player, dealer, ace]

    X, Y = np.meshgrid(player_sum, dealer_show)

    ax1.plot_wireframe(X, Y, state_values[:, :, 0])
    ax2.plot_wireframe(X, Y, state_values[:, :, 1])

    for ax in ax1, ax2:
        ax.set_zlim(-1, 1)
        ax.set_ylabel('player sum')
        ax.set_xlabel('dealer showing')
        ax.set_zlabel('state-value')

fig, axes = pyplot.subplots(nrows=2, figsize=(5, 8),
subplot_kw={'projection': '3d'})
axes[0].set_title('value function without usable ace')
axes[1].set_title('value function with usable ace')
plot_blackjack(value, axes[0], axes[1])


 2486
2486

 被折叠的 条评论
为什么被折叠?


