num_types = 7
count_i = [np.sum(labels[idx_train].numpy()==i) for i in range(num_types)]
matplotlib.rcParams['font.sans-serif'] = ['SimHei']
matplotlib.rcParams['axes.unicode_minus'] = False
rects = plt.bar(x=range(num_types), height=count_i, width=0.4, alpha=0.8, color='red', label="训练集")
for rect in rects:
height = rect.get_height()
plt.text(rect.get_x() + rect.get_width() / 2, height+1, str(height), ha="center", va="bottom")
plt.ylim(0,50)
plt.xlabel('节点类型')
plt.ylabel('数量')
plt.legend()
plt.show()
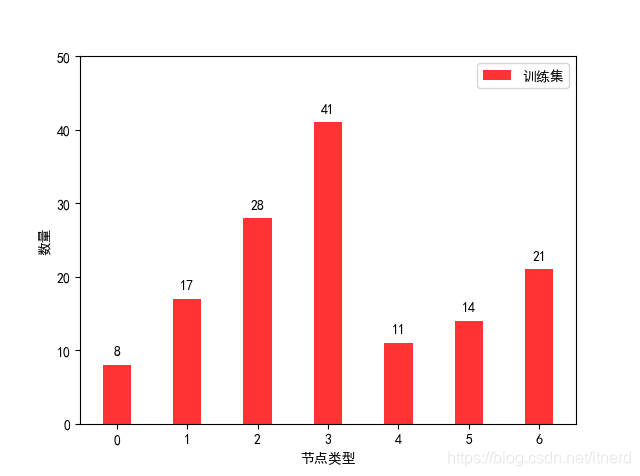
 训练集类型分布可视化


 4万+
4万+

 被折叠的 条评论
为什么被折叠?
被折叠的 条评论
为什么被折叠?
 到【灌水乐园】发言


