


 本文介绍了如何使用CellChat工具对细胞间通讯进行推断和分析。内容包括数据预处理、通信网络计算、可视化及系统分析。通过设置不同阈值,可以调整结果的噪音与敏感性。此外,还提供了识别细胞群体在通讯网络中的角色,以及探索信号通路协调性的方法。
cellchat需要两个输入:基因表达矩阵 + cell label。表达矩阵行为基因列为细胞,标准化+log。cell label为dataframe,行名为细胞,第一列为cell label.
从seurat v3 object中提取cell chat 所需要的两个输入文件:
data.input <- GetAssayData(seurat_object, assay = "RNA", slot = "data") # normalized data matrix
labels <- Idents(seurat_object)
meta <- data.frame(group = labels, row.names = names(labels)) # create a dataframe of the cell labels
library(CellChat)
library(patchwork)
options(stringsAsFactors = FALSE)
- part I: data input and preprocessing, initialization of the cellchat object
(1)load data
# Here we load a scRNA-seq data matrix and its associated cell meta data
#load(url("https://ndownloader.figshare.com/files/25950872"))
# This is a combined data from two biological conditions: normal and diseases

load("/Users/suoqinjin/Documents/CellChat/tutorial/data_humanSkin_CellChat.rda")

data.input = data_humanSkin$data # normalized data matrix

meta = data_humanSkin$meta # a dataframe with rownames containing cell mata data

cell.use = rownames(meta)[meta$condition == "LS"] # extract the cell names from disease data

# Prepare input data for CelChat analysis
data.input = data.input[, cell.use]
meta = meta[cell.use, ]
# meta = data.frame(labels = meta$labels[cell.use], row.names = colnames(data.input)) # manually create a dataframe consisting of the cell labels

unique(meta$labels) # check the cell labels
#>  [1] Inflam. FIB  FBN1+ FIB    APOE+ FIB    COL11A1+ FIB cDC2
#>  [6] LC           Inflam. DC   cDC1         CD40LG+ TC   Inflam. TC
#> [11] TC           NKT
#> 12 Levels: APOE+ FIB FBN1+ FIB COL11A1+ FIB Inflam. FIB cDC1 cDC2 ... NKT
(2)create a cellchat object
cellchat <- createCellChat(object = data.input, meta = meta, group.by = "labels")(3)set the ligand-receptor interaction database
CellChatDB <- CellChatDB.human # use CellChatDB.mouse if running on mouse data
showDatabaseCategory(CellChatDB)

# Show the structure of the database
dplyr::glimpse(CellChatDB$interaction)

# use a subset of CellChatDB for cell-cell communication analysis
CellChatDB.use <- subsetDB(CellChatDB, search = "Secreted Signaling") # use Secreted Signaling

# use all CellChatDB for cell-cell communication analysis
# CellChatDB.use <- CellChatDB # simply use the default CellChatDB

# set the used database in the object
cellchat@DB <- CellChatDB.use
(4)preprocessing the gene expression data
# subset the expression data of signaling genes for saving computation cost
cellchat <- subsetData(cellchat) # This step is necessary even if using the whole database
future::plan("multiprocess", workers = 4) # do parallel

cellchat <- identifyOverExpressedGenes(cellchat)
cellchat <- identifyOverExpressedInteractions(cellchat)
# project gene expression data onto PPI network (optional)
cellchat <- projectData(cellchat, PPI.human)
- Part II: Inference of cell-cell communication network
在核心功能computeCommuProb中,可以设置不同的阈值。默认为trimean(25%),也可以设置成10%、5%等。这个阈值什么意思?当某个cell group中表达某个pair的细胞比例低于此值时,他们的平均表达量就都是零(不会出现在结果里),调低阈值能发现更多通讯,但相应的噪音也更大。调整方法:type = "truncatedMean", trim = 0.1
(1)compute the communication probability and infer the celluar communication network
cellchat <- computeCommunProb(cellchat)

# Filter out the cell-cell communication if there are only few number of cells in certain cell groups
cellchat <- filterCommunication(cellchat, min.cells = 10)
(2) extract the infered celluar communication network as a dataframe
We provide a function subsetCommunication to easily access the inferred cell-cell communications of interest. For example,
-
df.net <- subsetCommunication(cellchat)returns a data frame consisting of all the inferred cell-cell communications at the level of ligands/receptors. Setslot.name = "netP"to access the the inferred communications at the level of signaling pathways -
df.net <- subsetCommunication(cellchat, sources.use = c(1,2), targets.use = c(4,5))gives the inferred cell-cell communications sending from cell groups 1 and 2 to cell groups 4 and 5. -
df.net <- subsetCommunication(cellchat, signaling = c("WNT", "TGFb"))gives the inferred cell-cell communications mediated by signaling WNT and TGFb.
(3)infer the communication network at a signaling pathway level
注:前面以pair为单位的结果存储在“net” slot, 而pathway推断结果在“netP”slot.
cellchat <- computeCommunProbPathway(cellchat)(4)calculate the aggregated communication network
USER can also calculate the aggregated network among a subset of cell groups by setting sources.use and targets.use.
cellchat <- aggregateNet(cellchat)两种可视化思路:一种线条粗细反应数量,一种反映weights.
groupSize <- as.numeric(table(cellchat@idents))
par(mfrow = c(1,2), xpd=TRUE)

netVisual_circle(cellchat@net$count, vertex.weight = groupSize, weight.scale = T, label.edge= F, title.name = "Number of interactions")

netVisual_circle(cellchat@net$weight, vertex.weight = groupSize, weight.scale = T, label.edge= F, title.name = "Interaction weights/strength")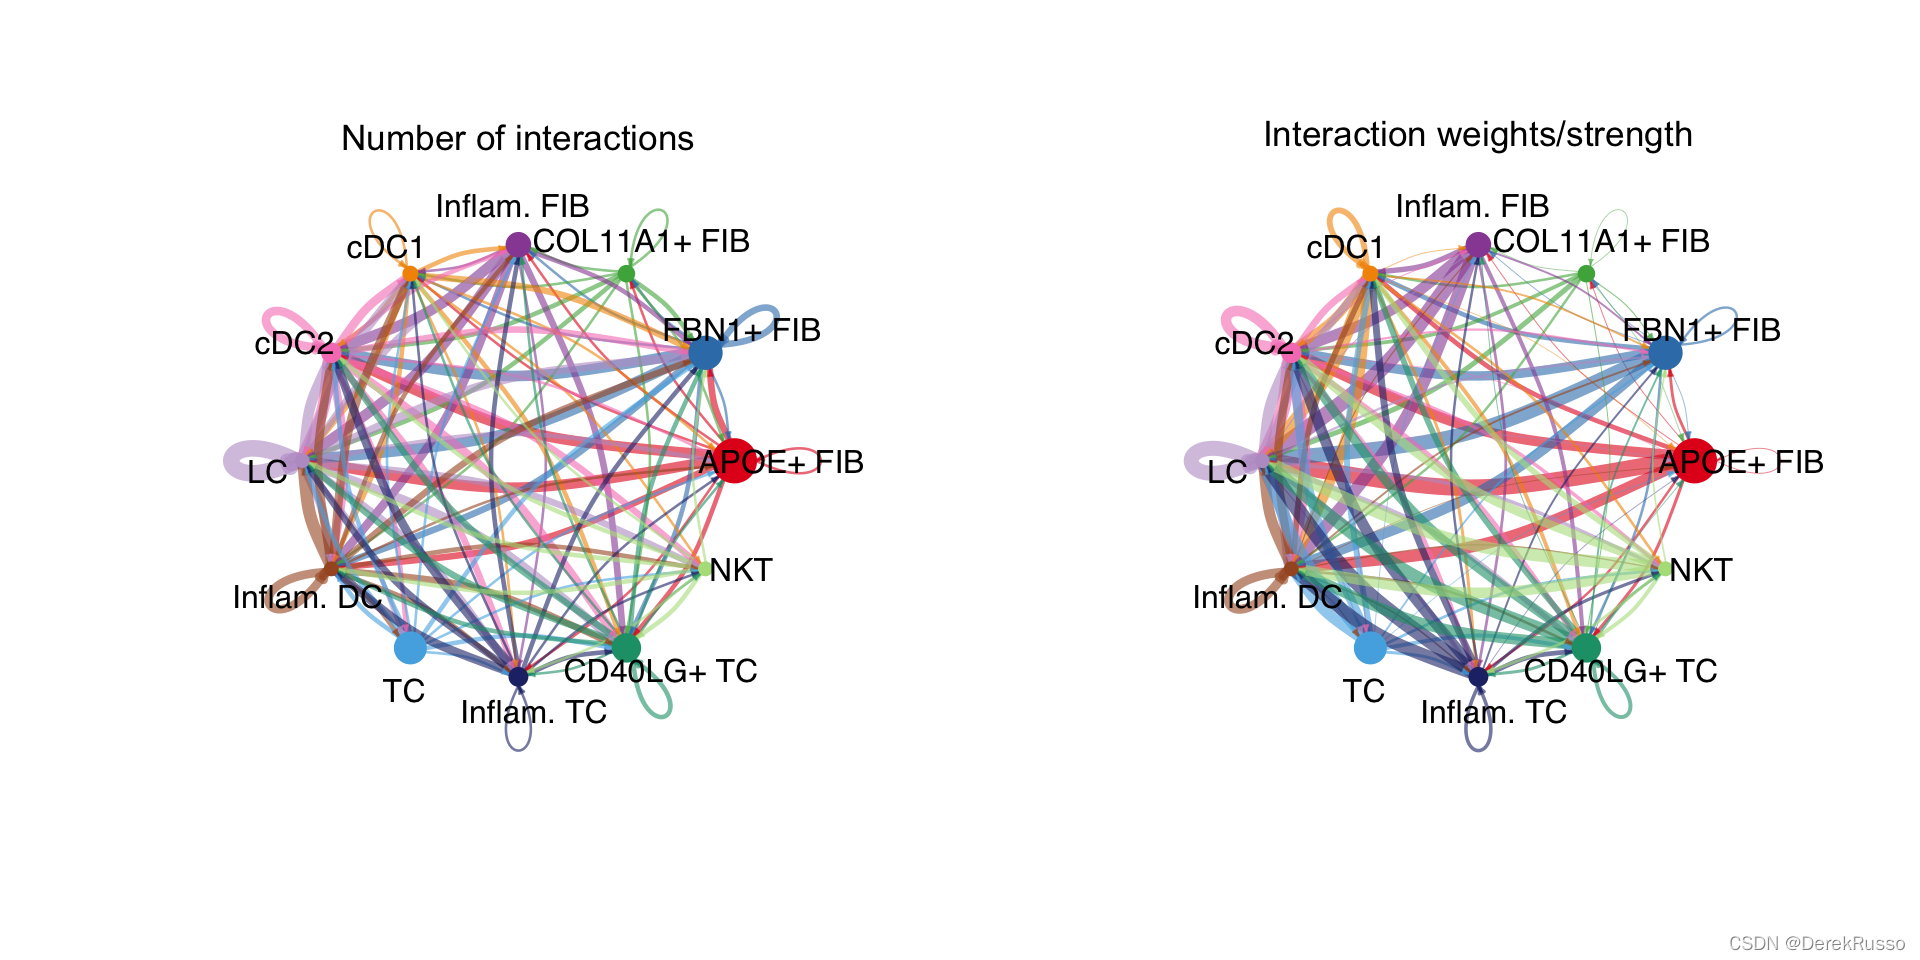
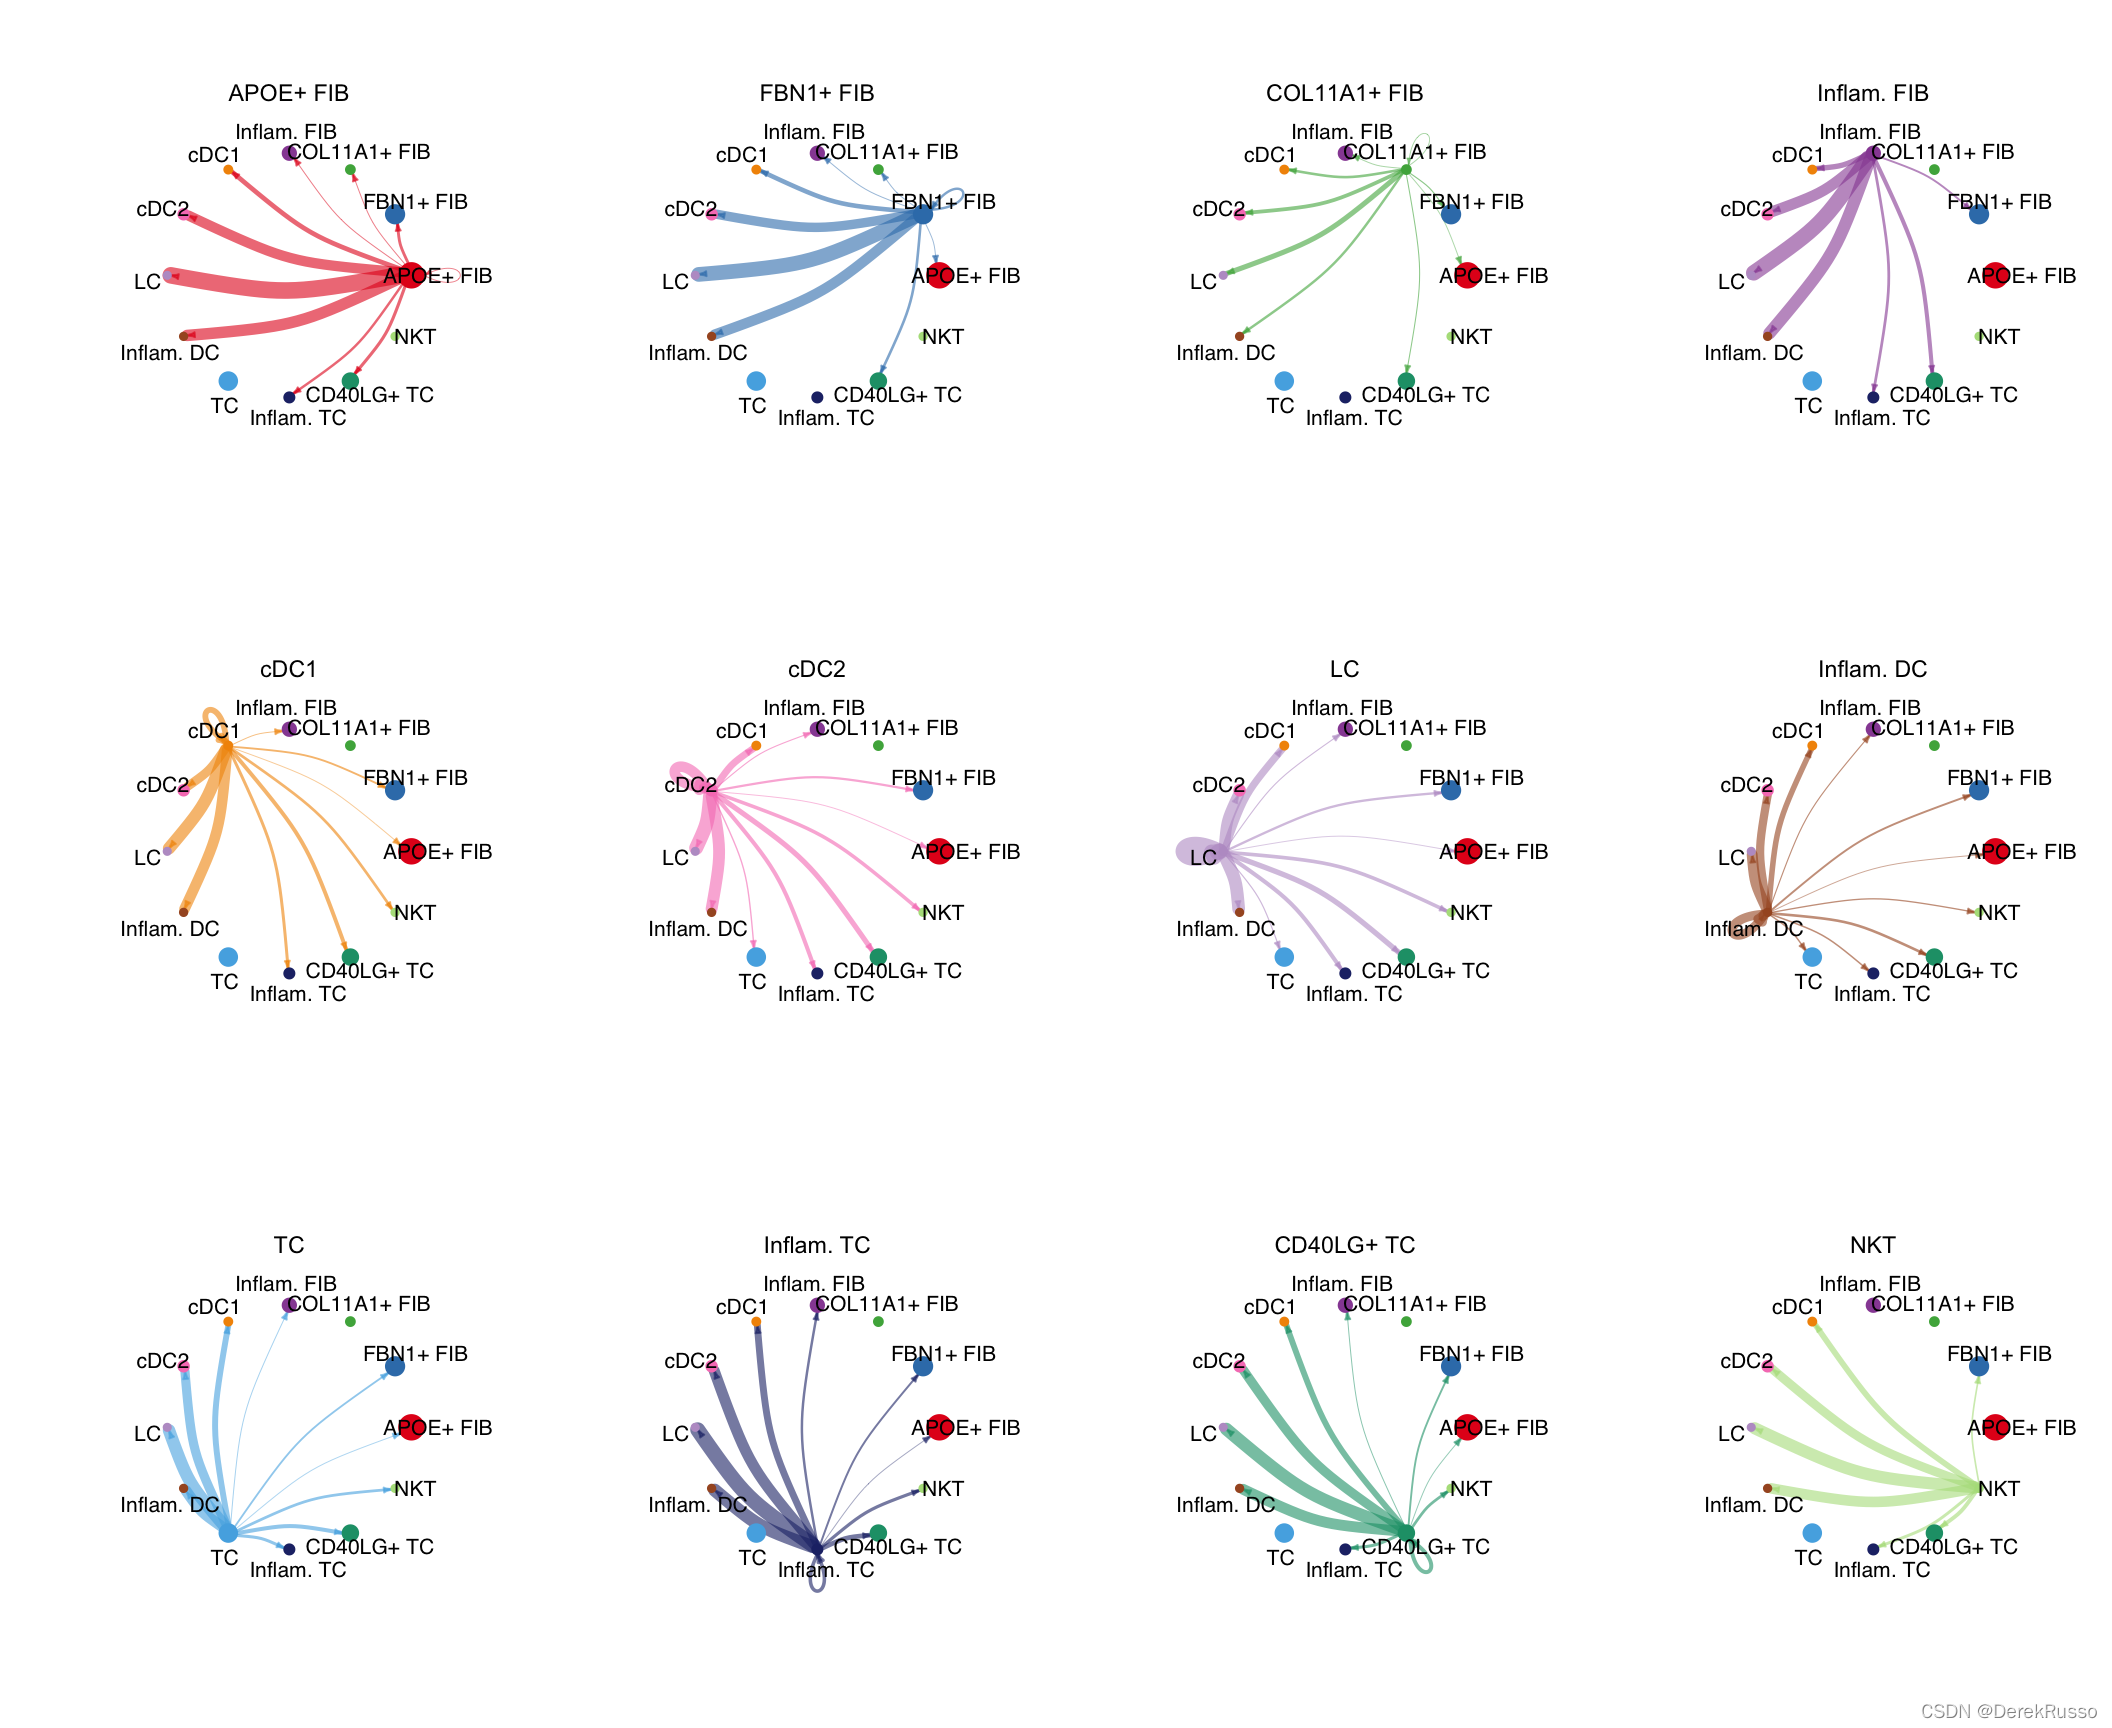
可视化从每种细胞类型发出的
mat <- cellchat@net$weight
par(mfrow = c(3,4), xpd=TRUE)
for (i in 1:nrow(mat)) {
  mat2 <- matrix(0, nrow = nrow(mat), ncol = ncol(mat), dimnames = dimnames(mat))
  mat2[i, ] <- mat[i, ]
  netVisual_circle(mat2, vertex.weight = groupSize, weight.scale = T, edge.weight.max = max(mat), title.name = rownames(mat)[i])
}
- part III : visualization of the communication network
(1)visualize each signaling pathway 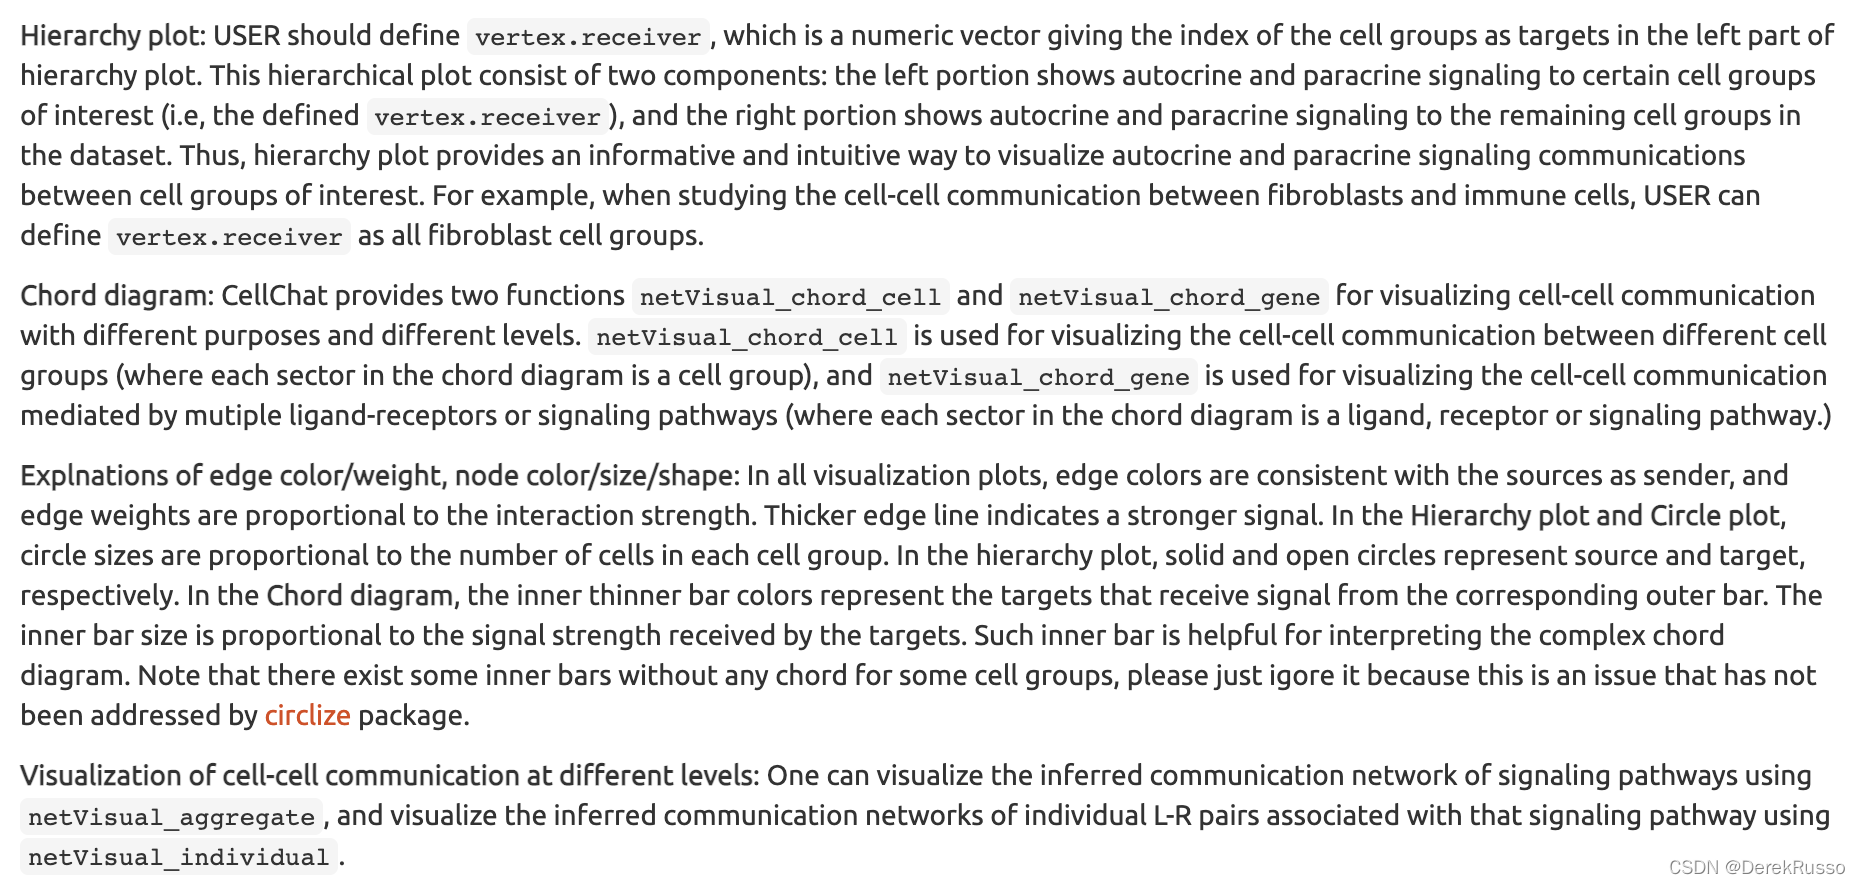
所有显著的通讯通路都可以通过cellchat@netP$pathways查看
pathways.show <- c("CXCL")

# Hierarchy plot
# Here we define `vertex.receive` so that the left portion of the hierarchy plot shows signaling to fibroblast and the right portion shows signaling to immune cells

vertex.receiver = seq(1,4) # a numeric vector.
netVisual_aggregate(cellchat, signaling = pathways.show,  vertex.receiver = vertex.receiver)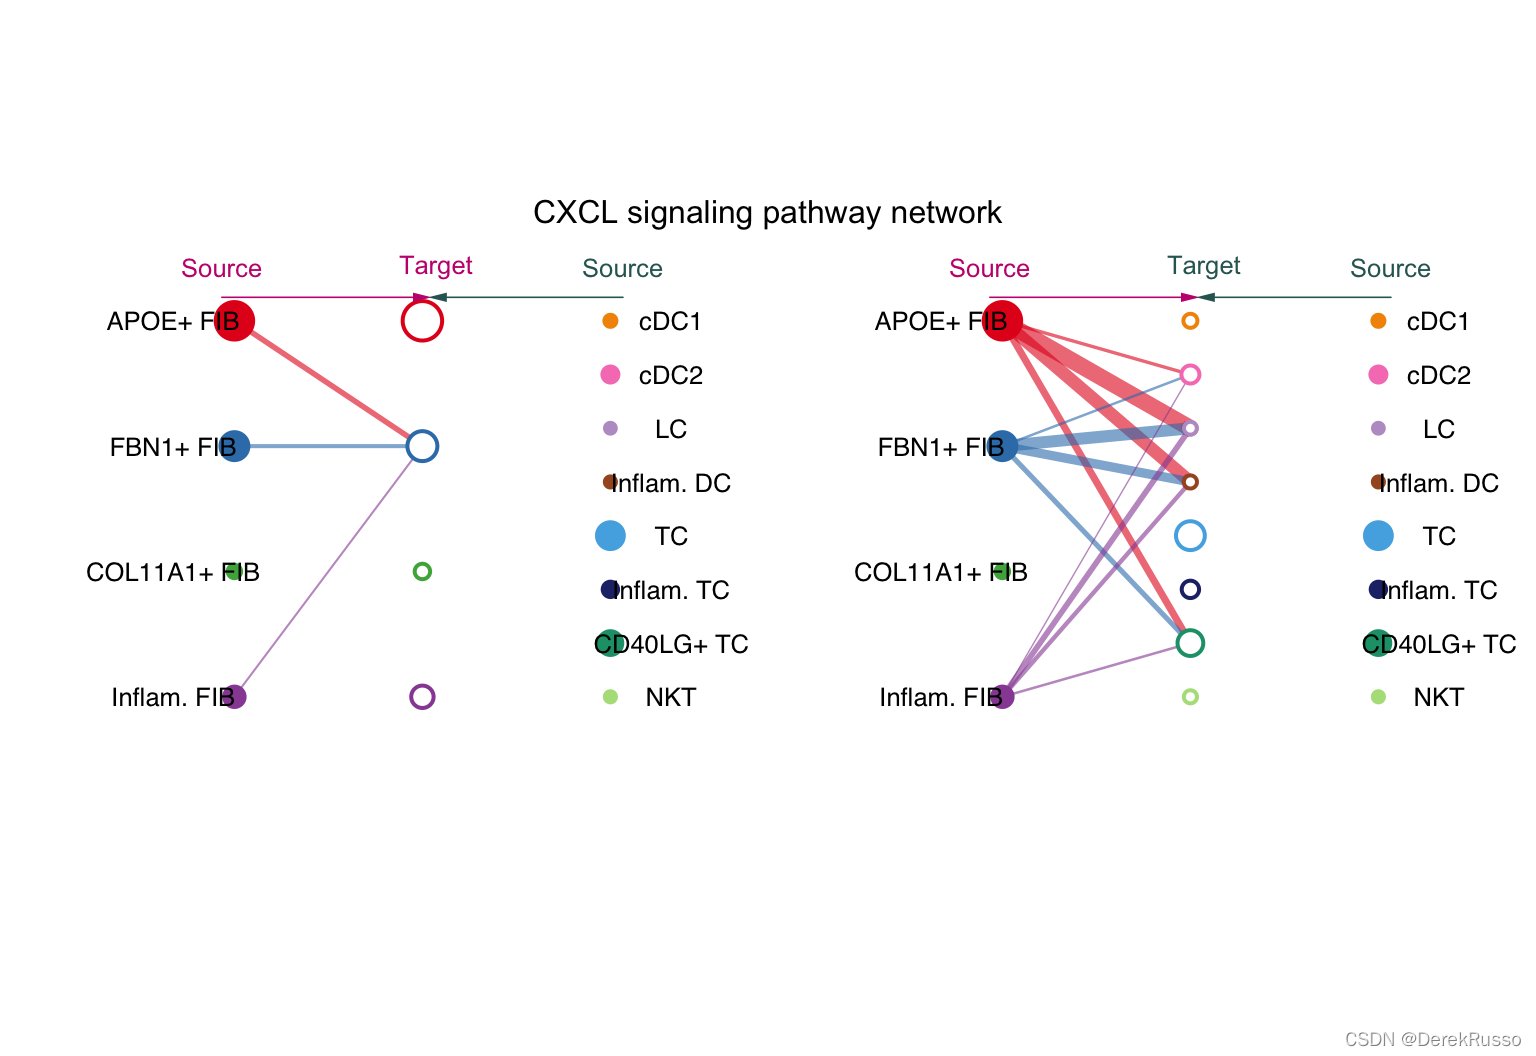
# Circle plot
par(mfrow=c(1,1))
netVisual_aggregate(cellchat, signaling = pathways.show, layout = "circle")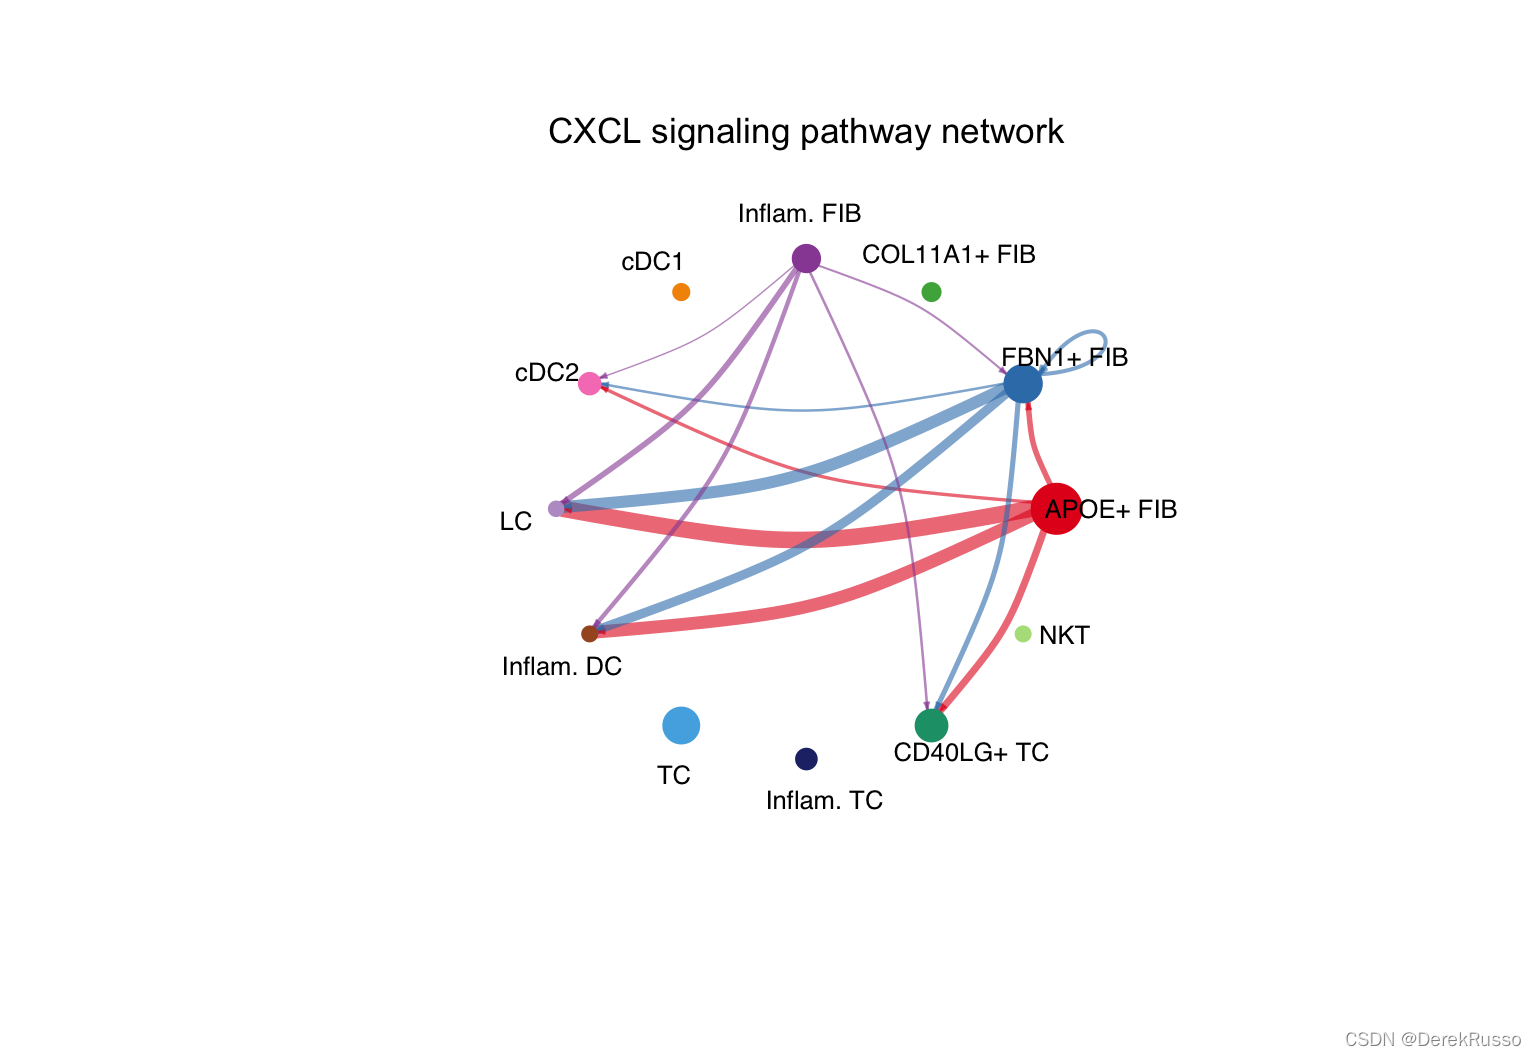
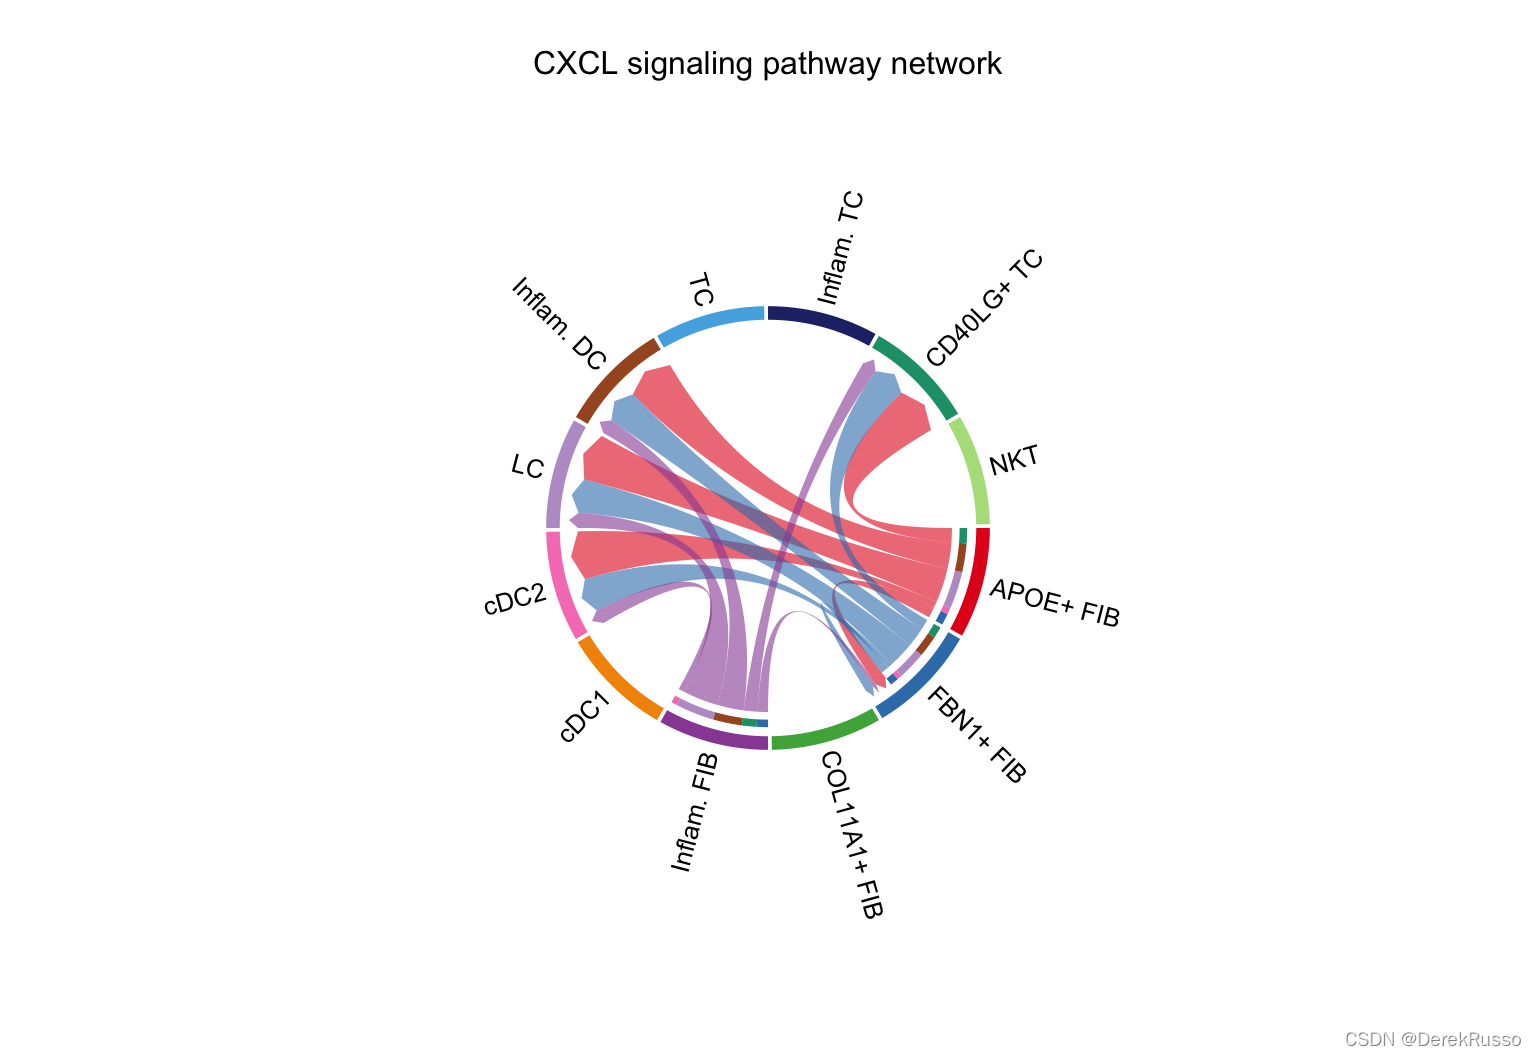
# Chord diagram
par(mfrow=c(1,1))
netVisual_aggregate(cellchat, signaling = pathways.show, layout = "chord")
#> Note: The first link end is drawn out of sector 'Inflam. FIB'.
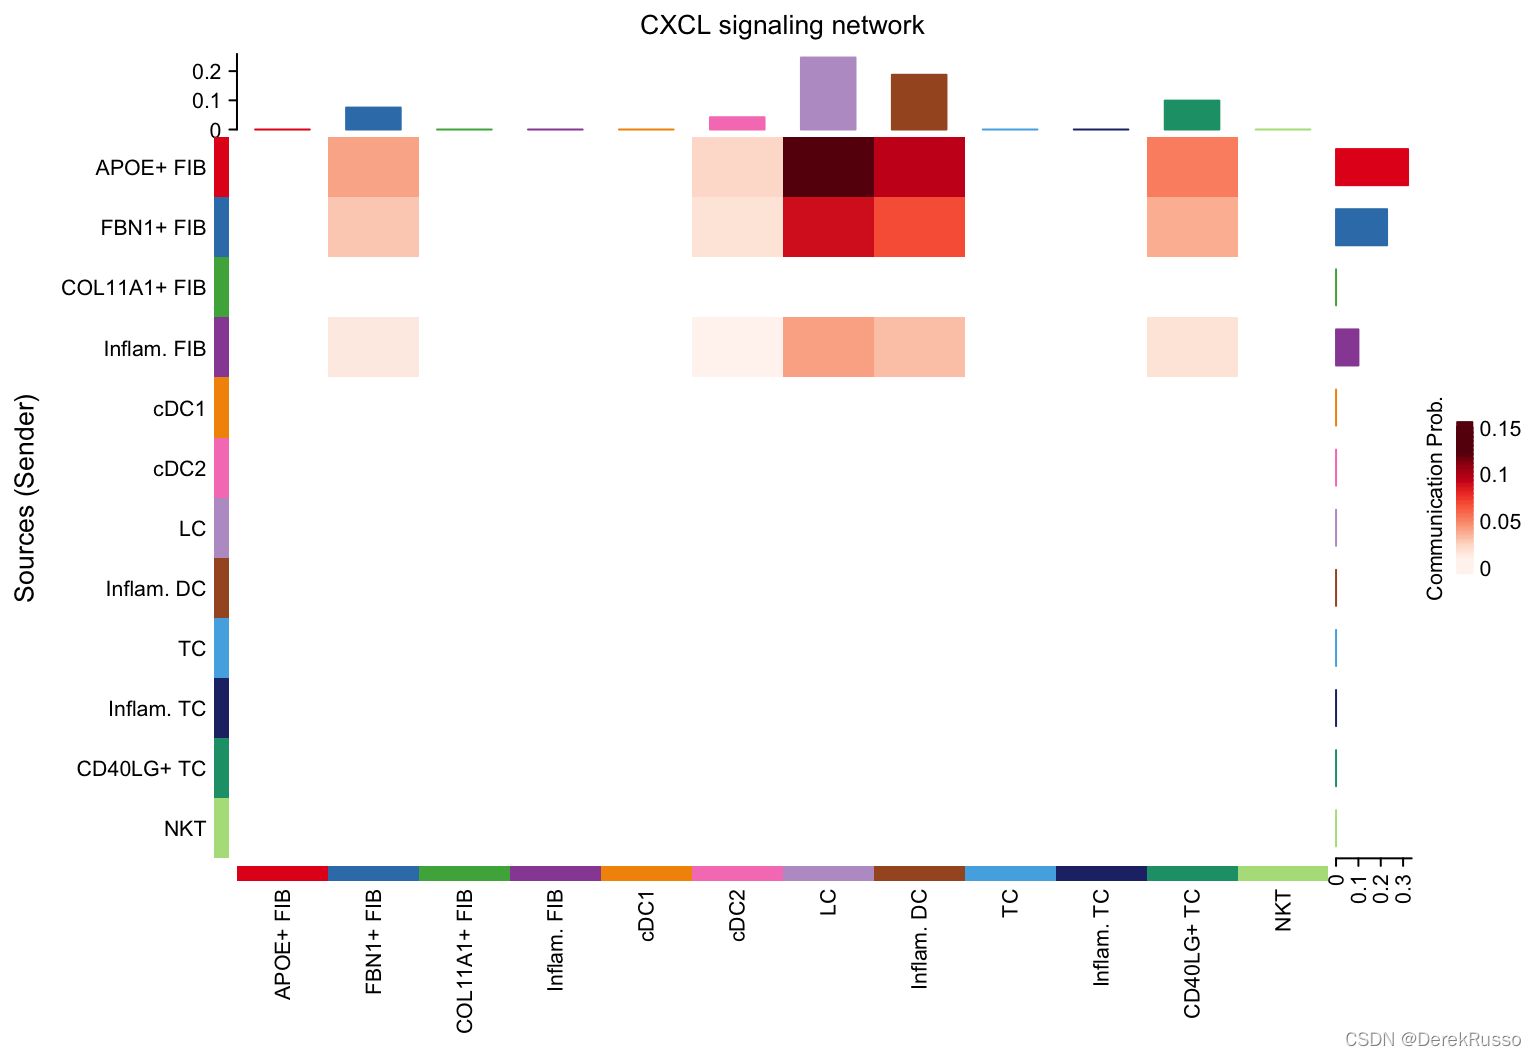
# Heatmap
par(mfrow=c(1,1))
netVisual_heatmap(cellchat, signaling = pathways.show, color.heatmap = "Reds")
(2)Compute the contribution of each ligand-receptor pair to the overall signaling pathway and visualize cell-cell communication mediated by a single ligand-receptor pair
netAnalysis_contribution(cellchat, signaling = pathways.show)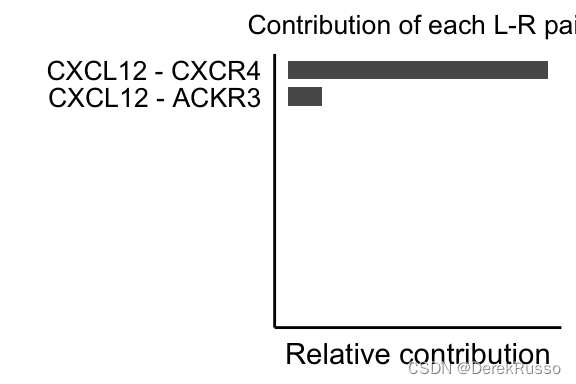
We provide a function extractEnrichedLR to extract all the significant interactions (L-R pairs) and related signaling genes for a given signaling pathway.
pairLR.CXCL <- extractEnrichedLR(cellchat, signaling = pathways.show, geneLR.return = FALSE)
LR.show <- pairLR.CXCL[1,] # show one ligand-receptor pair

# Hierarchy plot
vertex.receiver = seq(1,4) # a numeric vector
netVisual_individual(cellchat, signaling = pathways.show,  pairLR.use = LR.show, vertex.receiver = vertex.receiver)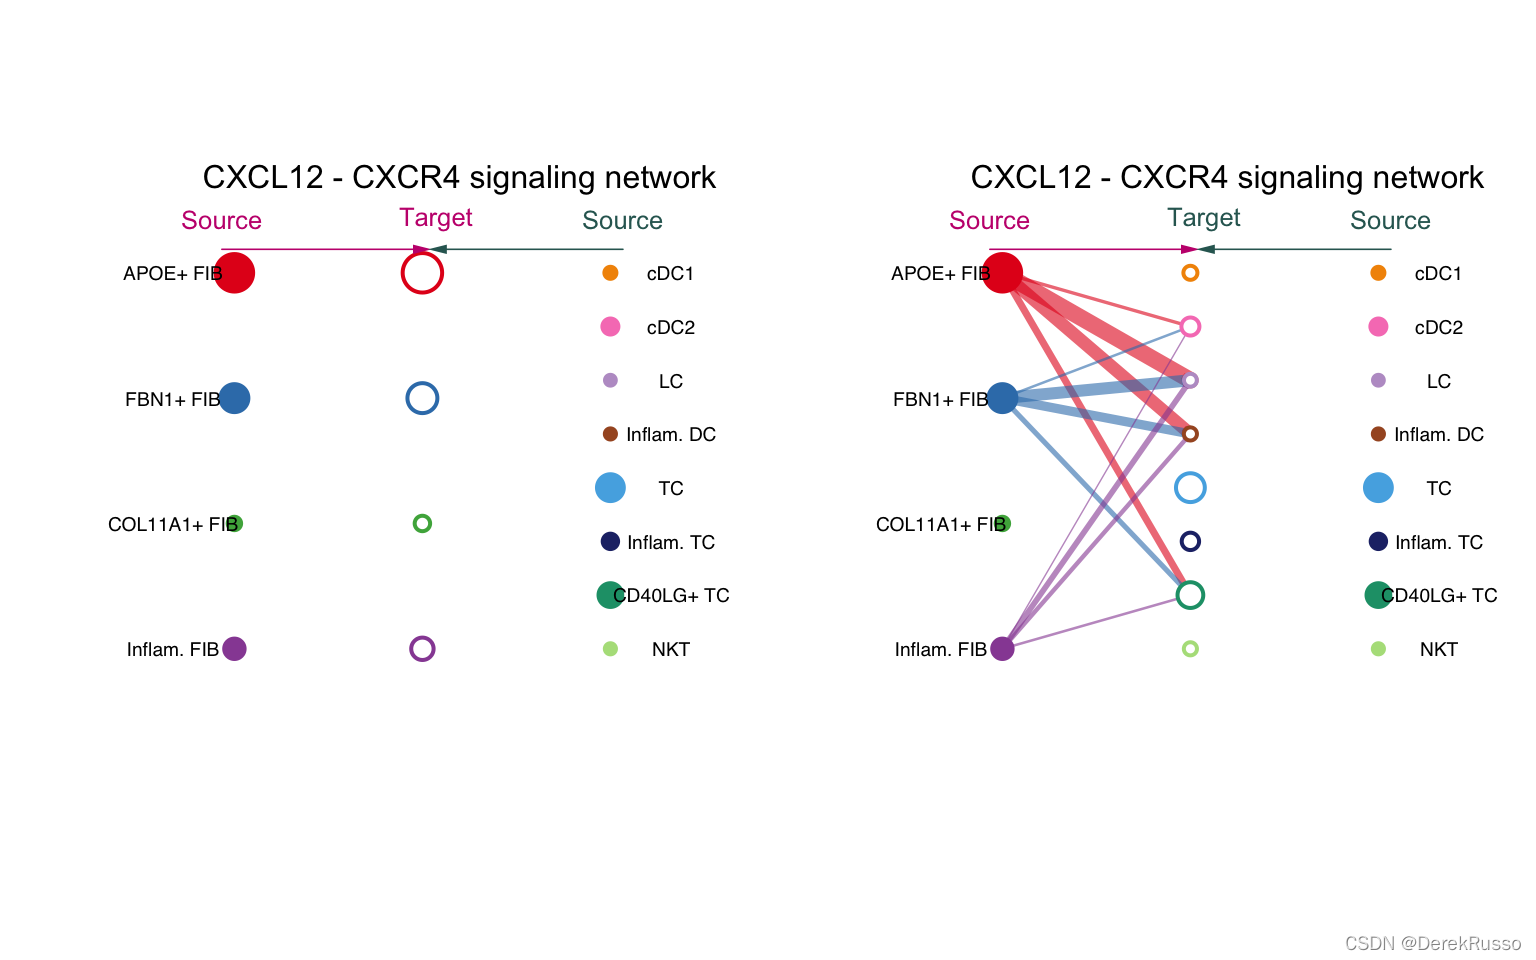
# Circle plot
netVisual_individual(cellchat, signaling = pathways.show, pairLR.use = LR.show, layout = "circle")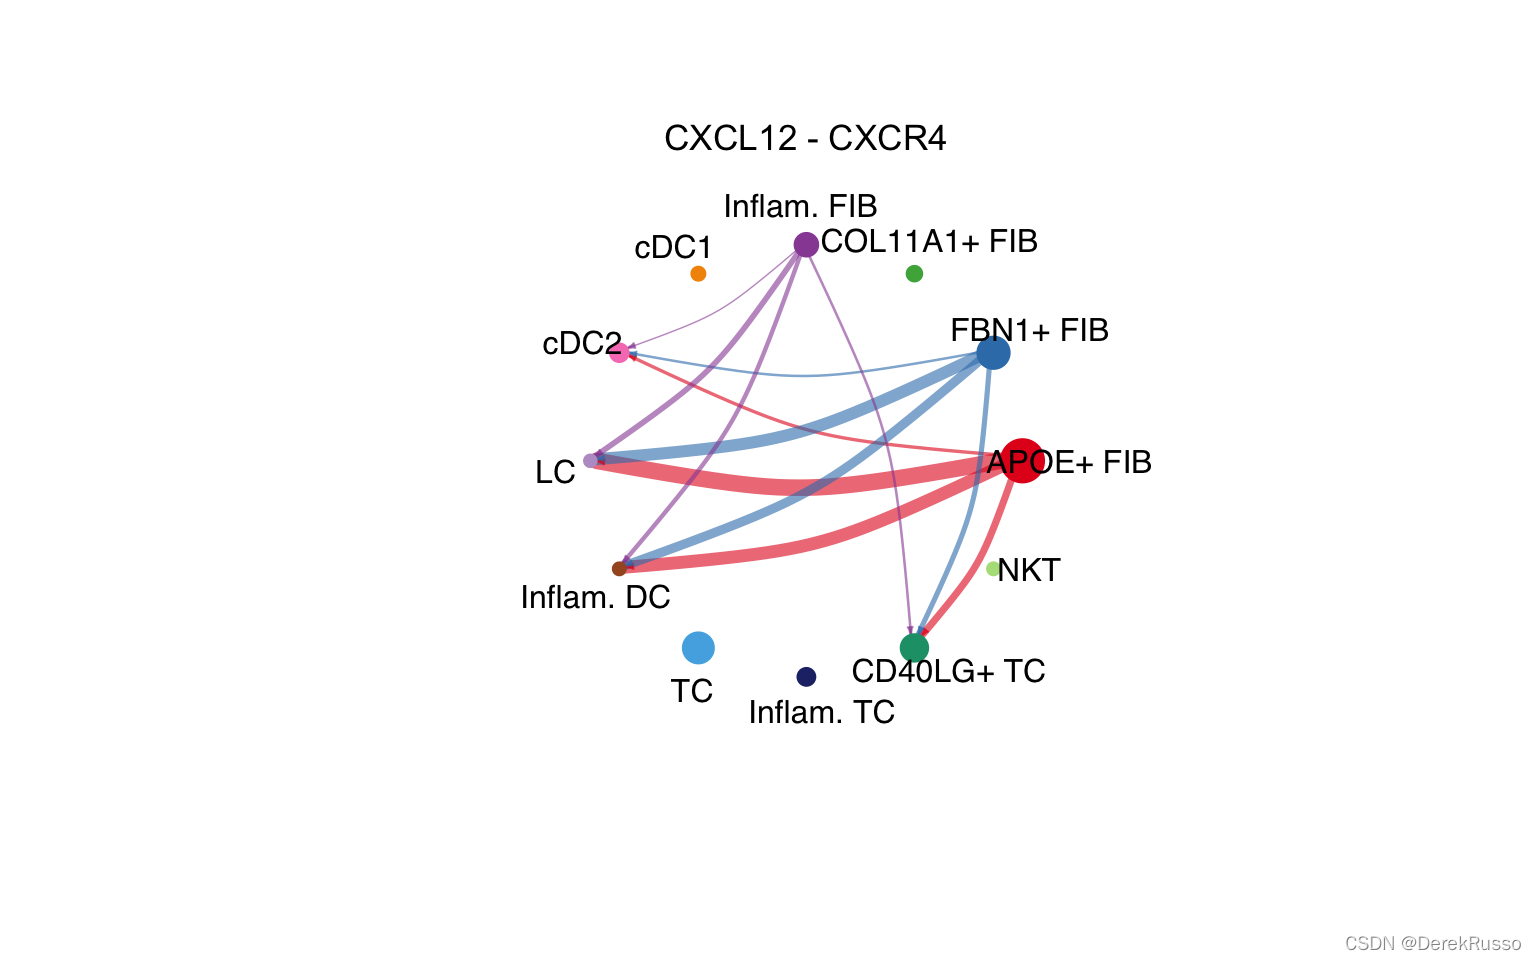
# Chord diagram
netVisual_individual(cellchat, signaling = pathways.show, pairLR.use = LR.show, layout = "chord")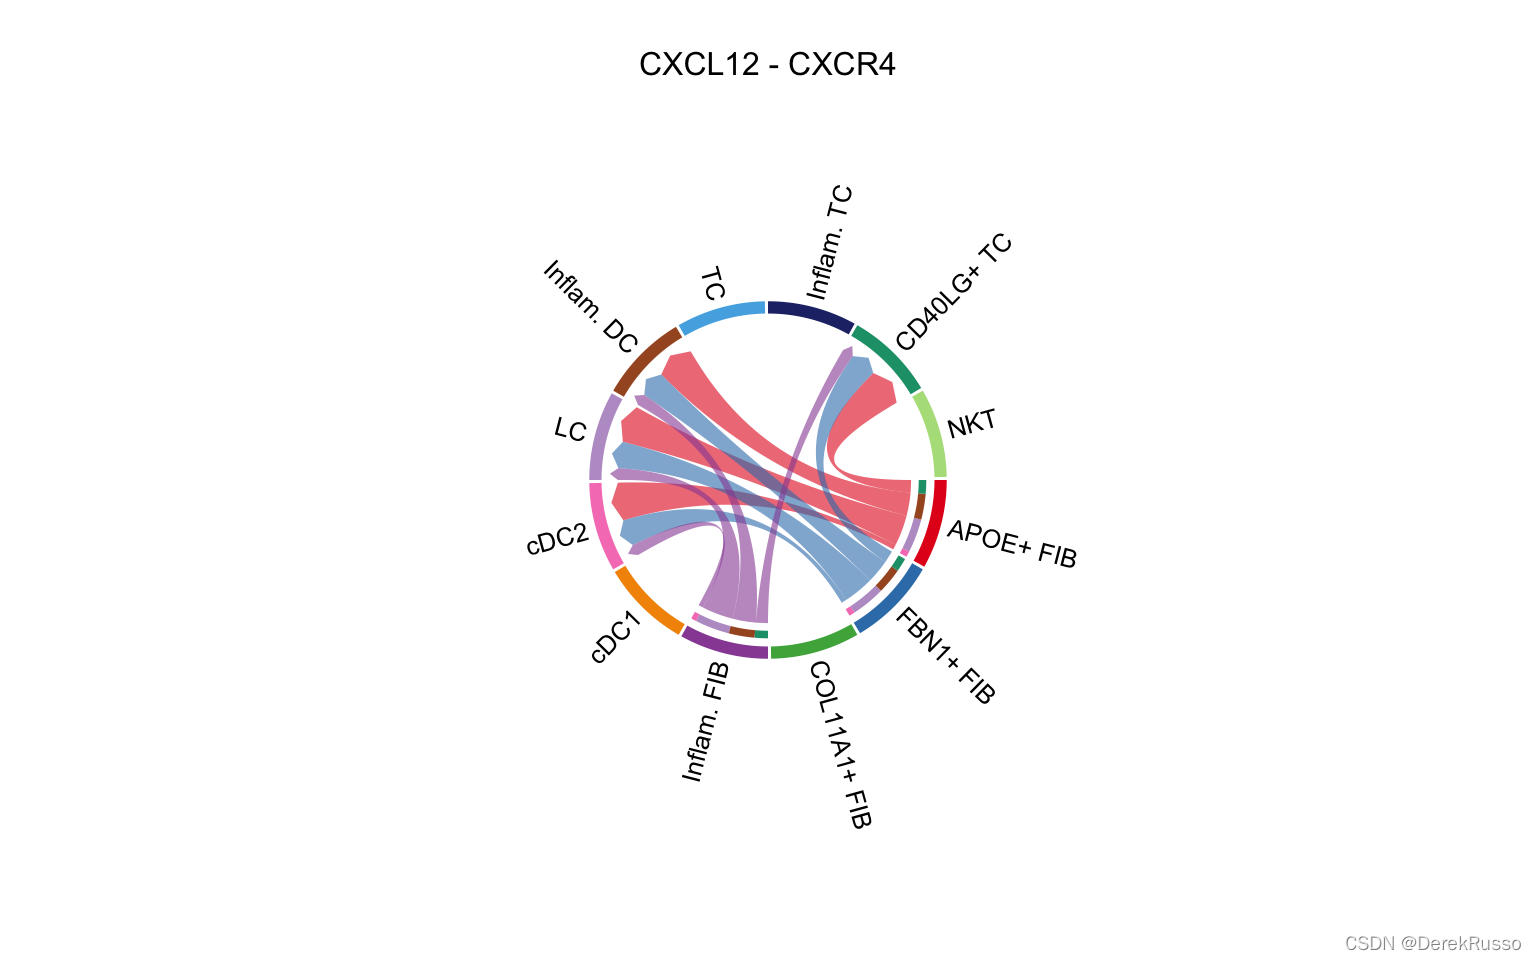
(3)visualize cell communications by multiple L-R pairs or pathways
气泡图
# show all the significant interactions (L-R pairs) from some cell groups (defined by 'sources.use') to other cell groups (defined by 'targets.use')

netVisual_bubble(cellchat, sources.use = 4, targets.use = c(5:11), remove.isolate = FALSE)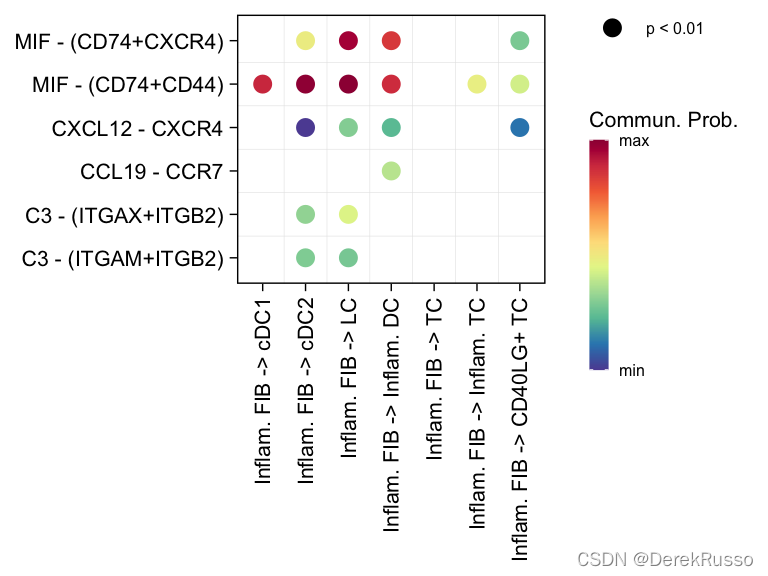
# show all the significant interactions (L-R pairs) associated with certain signaling pathways

netVisual_bubble(cellchat, sources.use = 4, targets.use = c(5:11), signaling = c("CCL","CXCL"), remove.isolate = FALSE)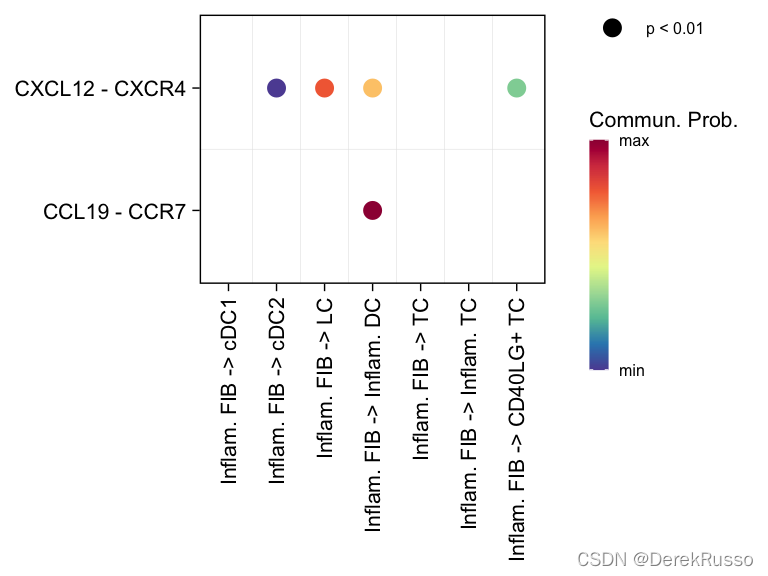
# show all the significant interactions (L-R pairs) based on user's input (defined by `pairLR.use`)

pairLR.use <- extractEnrichedLR(cellchat, signaling = c("CCL","CXCL","FGF"))
netVisual_bubble(cellchat, sources.use = c(3,4), targets.use = c(5:8), pairLR.use = pairLR.use, remove.isolate = TRUE)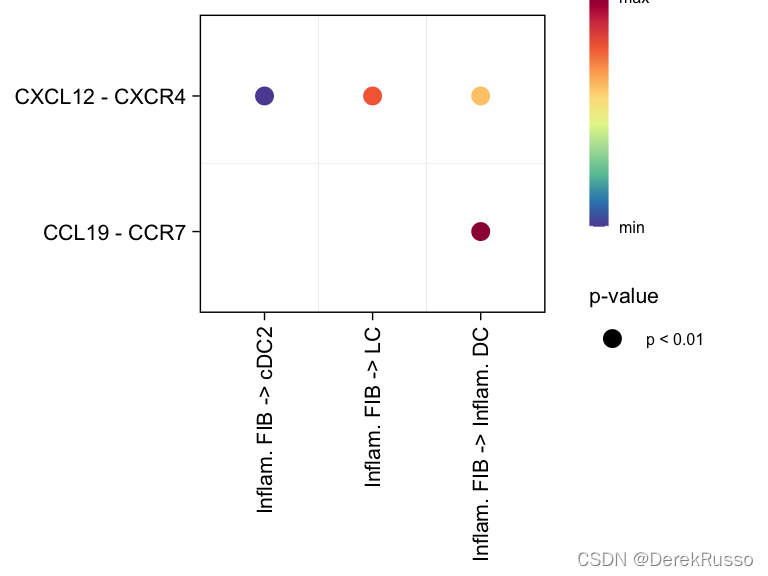
和弦图(和bubble图一样,既可以展示用户指定的target与sender之间的通讯关系,也可以展示用户指定的pair和pathway)
# show all the significant interactions (L-R pairs) from some cell groups (defined by 'sources.use') to other cell groups (defined by 'targets.use')

# show all the interactions sending from Inflam.FIB
netVisual_chord_gene(cellchat, sources.use = 4, targets.use = c(5:11), lab.cex = 0.5,legend.pos.y = 30)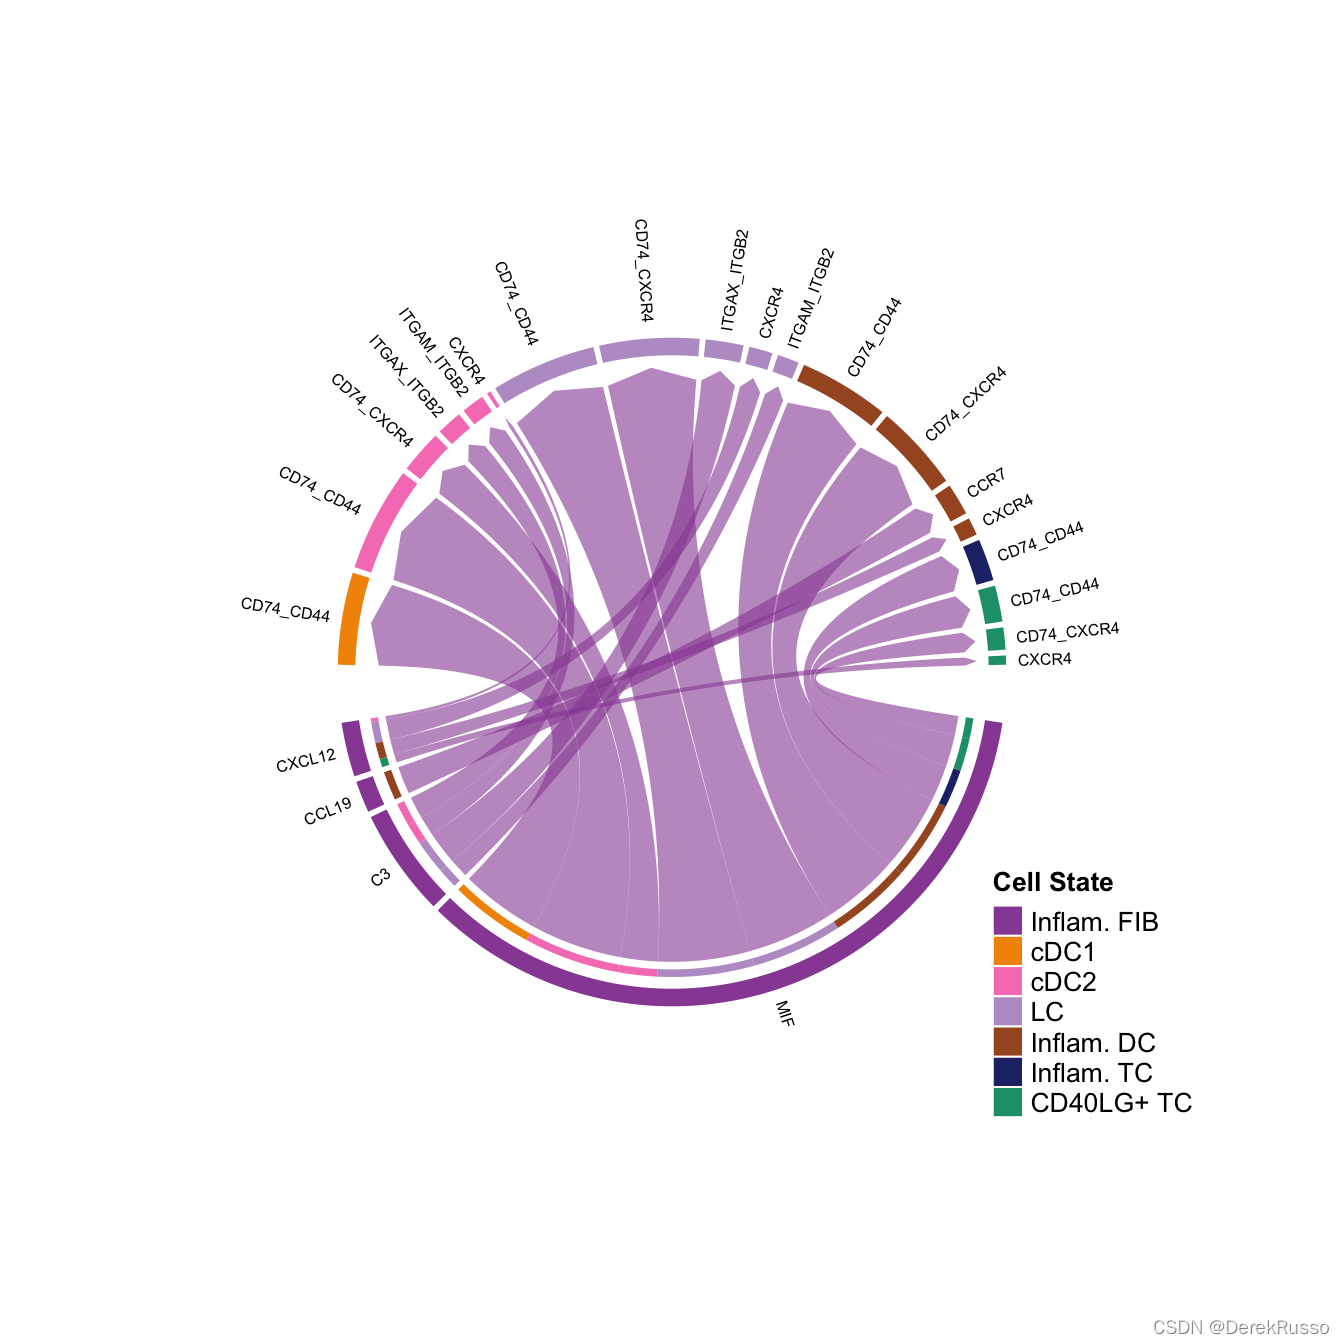
# show all the interactions received by Inflam.DC

netVisual_chord_gene(cellchat, sources.use = c(1,2,3,4), targets.use = 8, legend.pos.x = 15)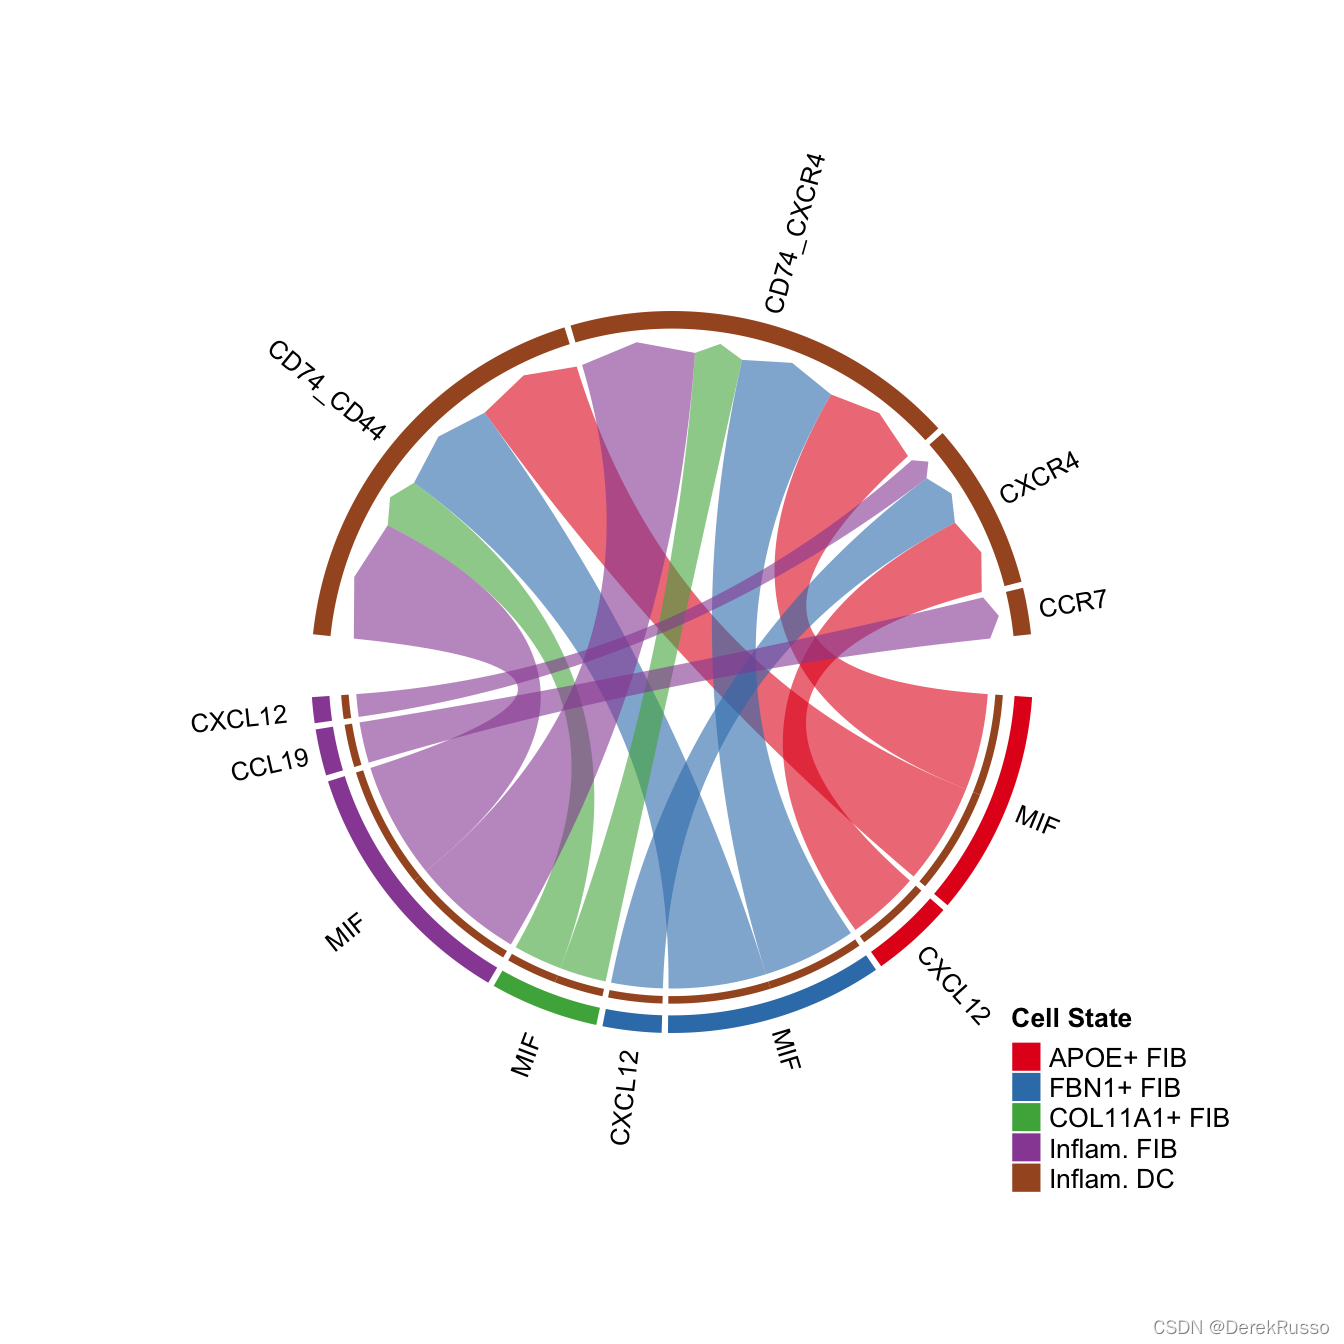
# show all the significant interactions (L-R pairs) associated with certain signaling pathways

netVisual_chord_gene(cellchat, sources.use = c(1,2,3,4), targets.use = c(5:11), signaling = c("CCL","CXCL"),legend.pos.x = 8)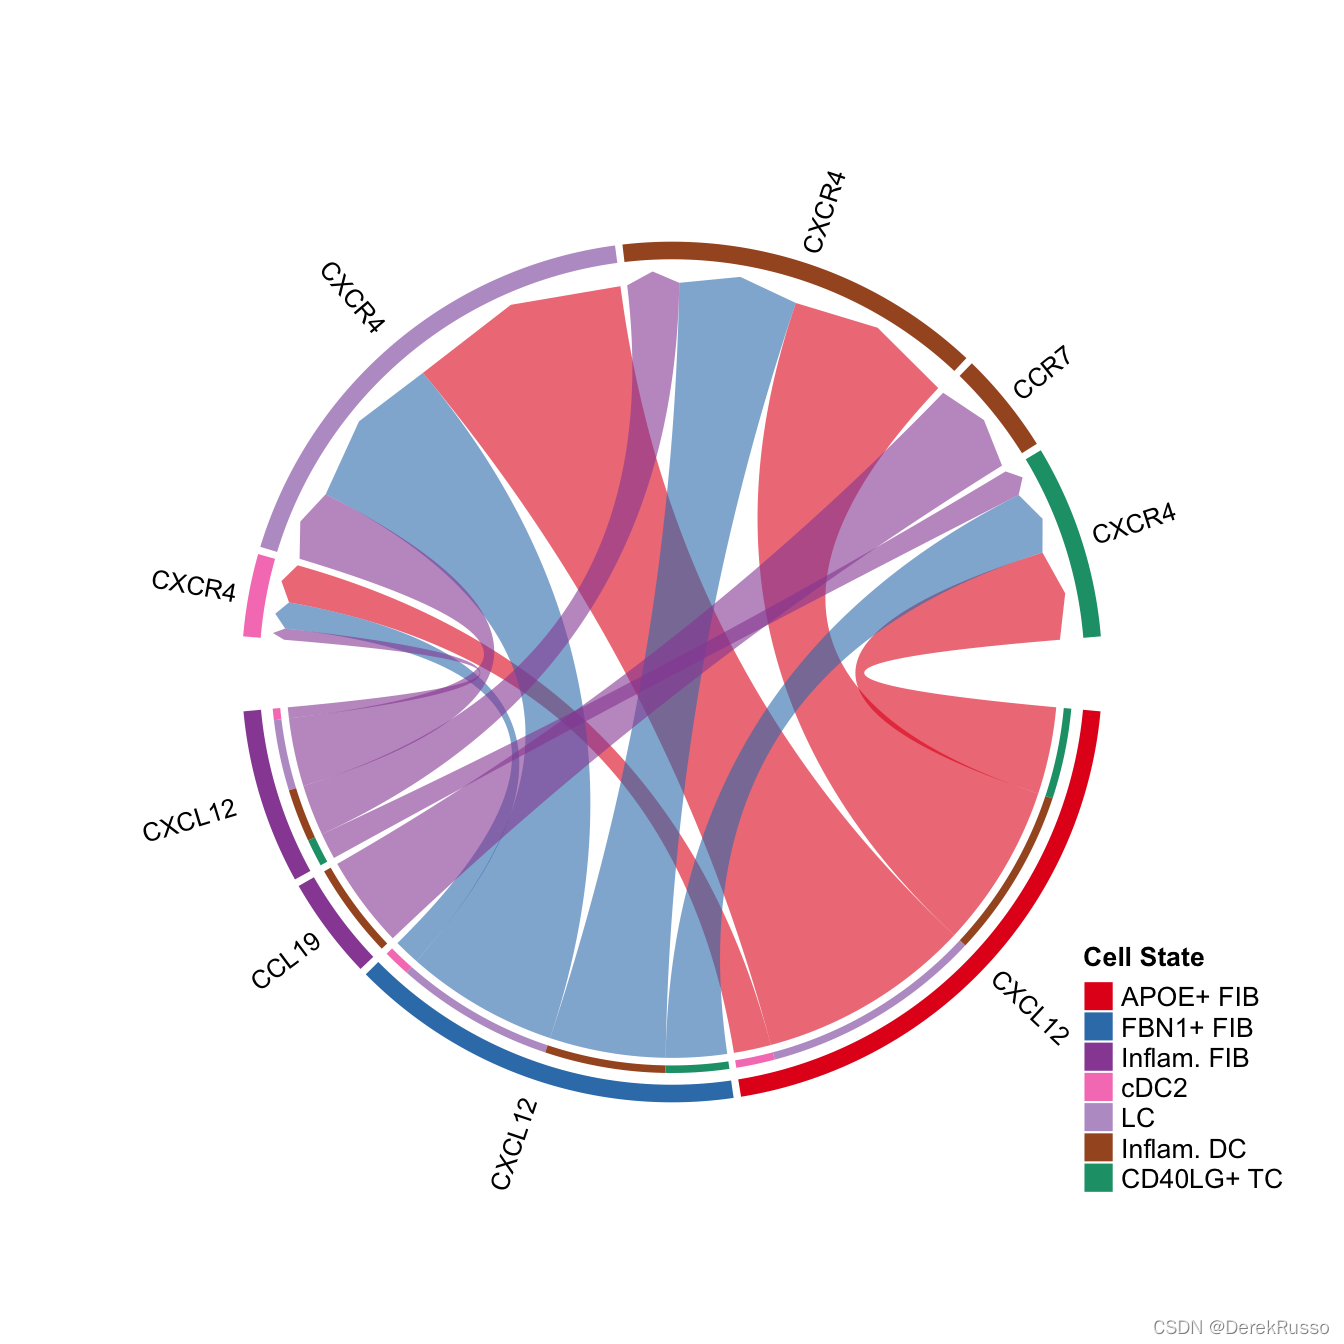
# show all the significant signaling pathways from some cell groups (defined by 'sources.use') to other cell groups (defined by 'targets.use')

netVisual_chord_gene(cellchat, sources.use = c(1,2,3,4), targets.use = c(5:11), slot.name = "netP", legend.pos.x = 10)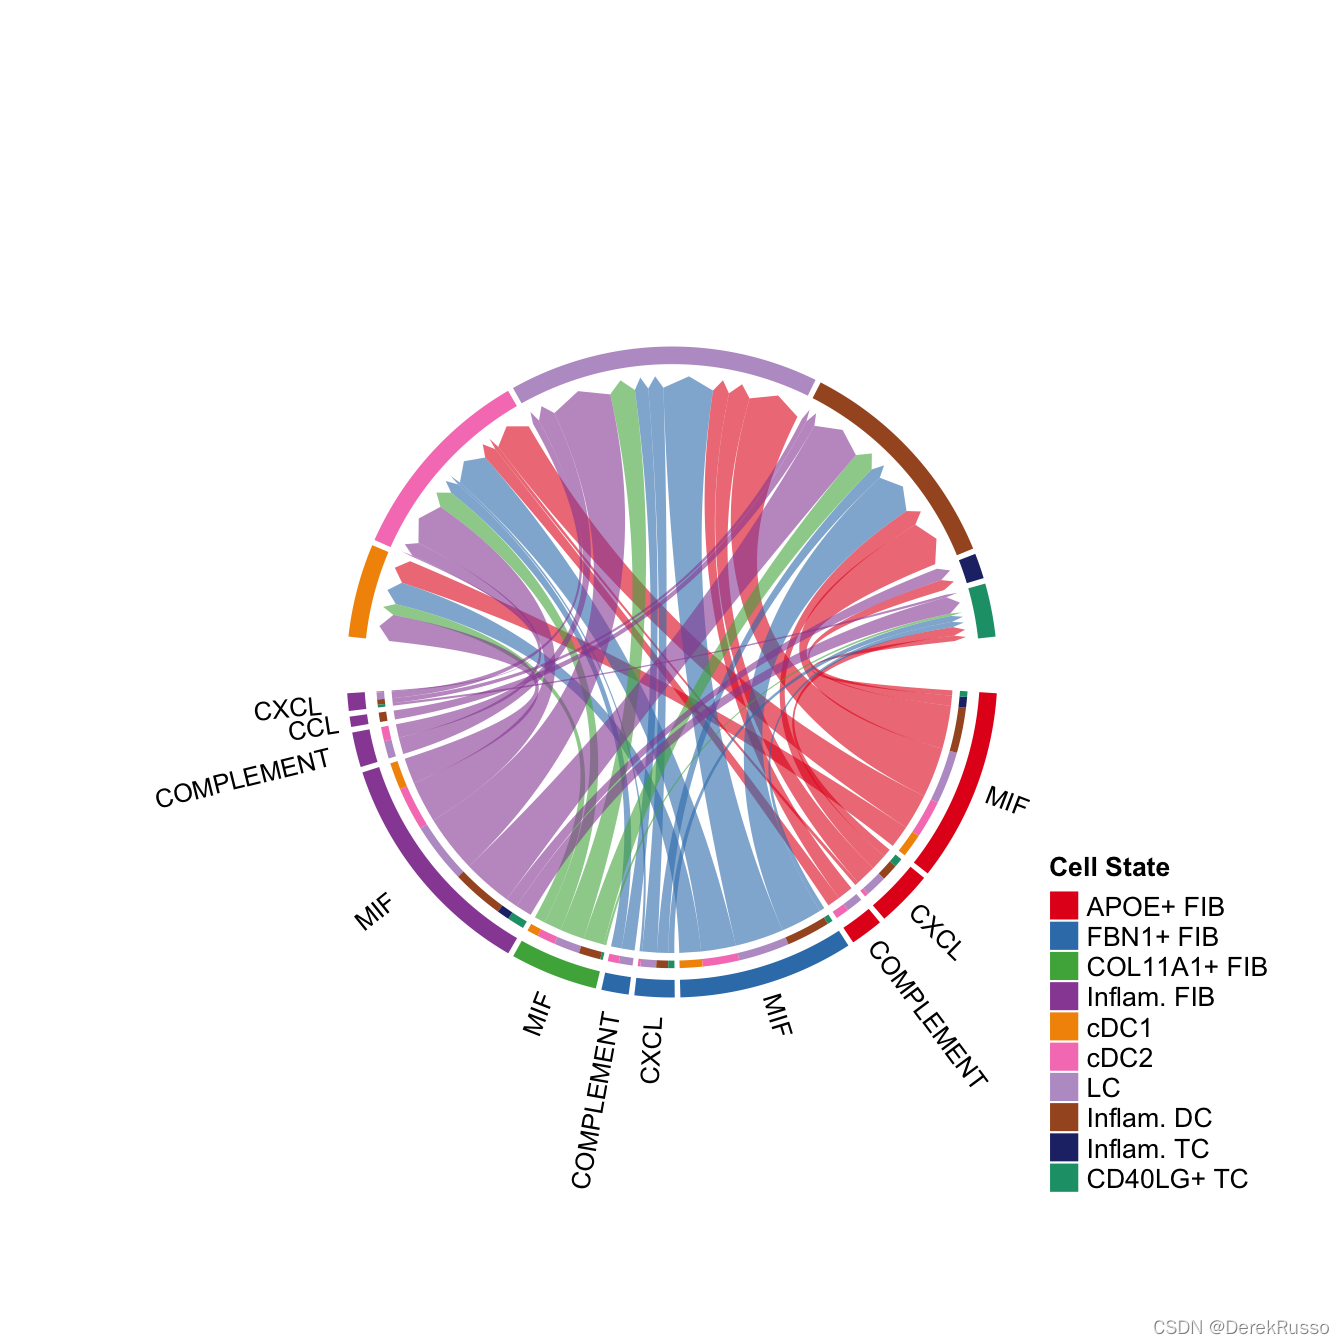
(4)plot the signaling gene expression distrobution by dot or violin plots
#来自seurat的wrapper功能

plotGeneExpression(cellchat, signaling = "CXCL")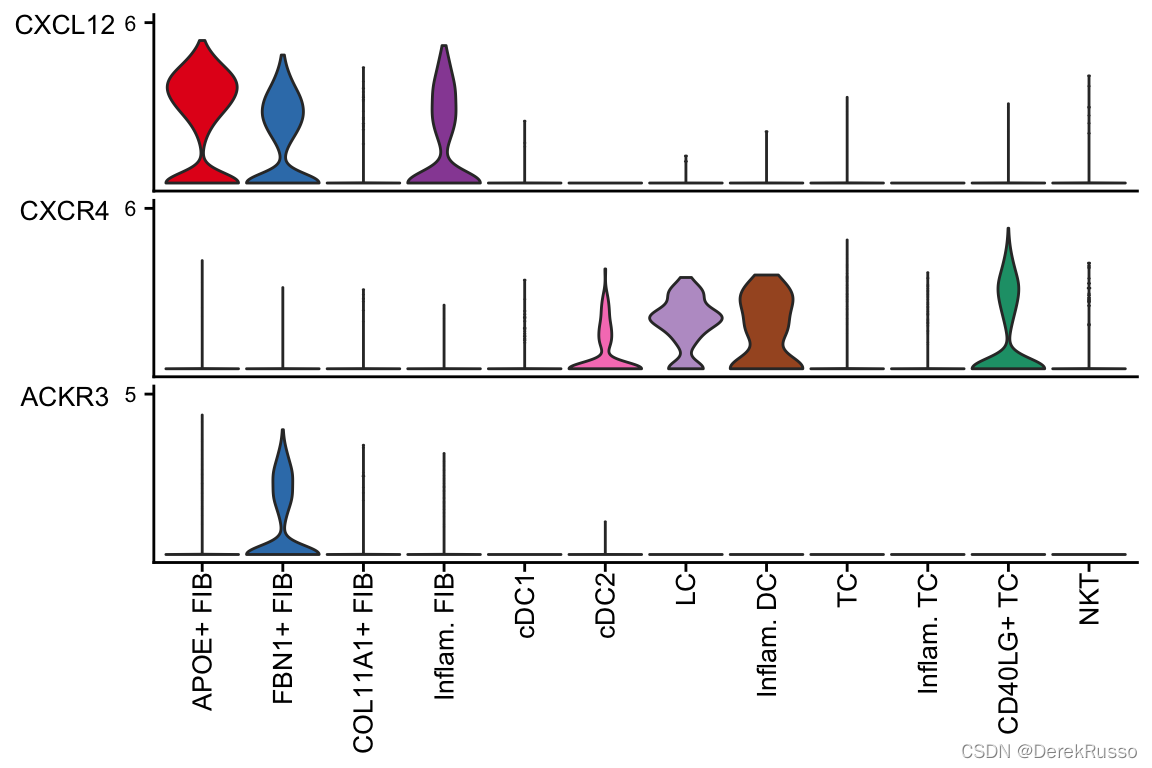
- part IV : systems analysis of cell-cell communication network
这是什么意思呢?
a. 根据已经构建好的通讯网络,发现其中的major sources, targets, influencers, mediators.
b. 对某些细胞类型,预测其关键的incoming and outgoing signals,包括coordinated responses among different cell types
c. group signaling pathways
d. delineate conserved and context-specific signaling pathways
(1)identify signaling roles of cell groups as well as the major contributing signaling (dominant senders and receivers)
# Compute the network centrality scores

cellchat <- netAnalysis_computeCentrality(cellchat, slot.name = "netP")
# the slot 'netP' means the inferred intercellular communication network of signaling pathways


# Visualize the computed centrality scores using heatmap, allowing ready identification of major signaling roles of cell groups

netAnalysis_signalingRole_network(cellchat, signaling = pathways.show, width = 8, height = 2.5, font.size = 10)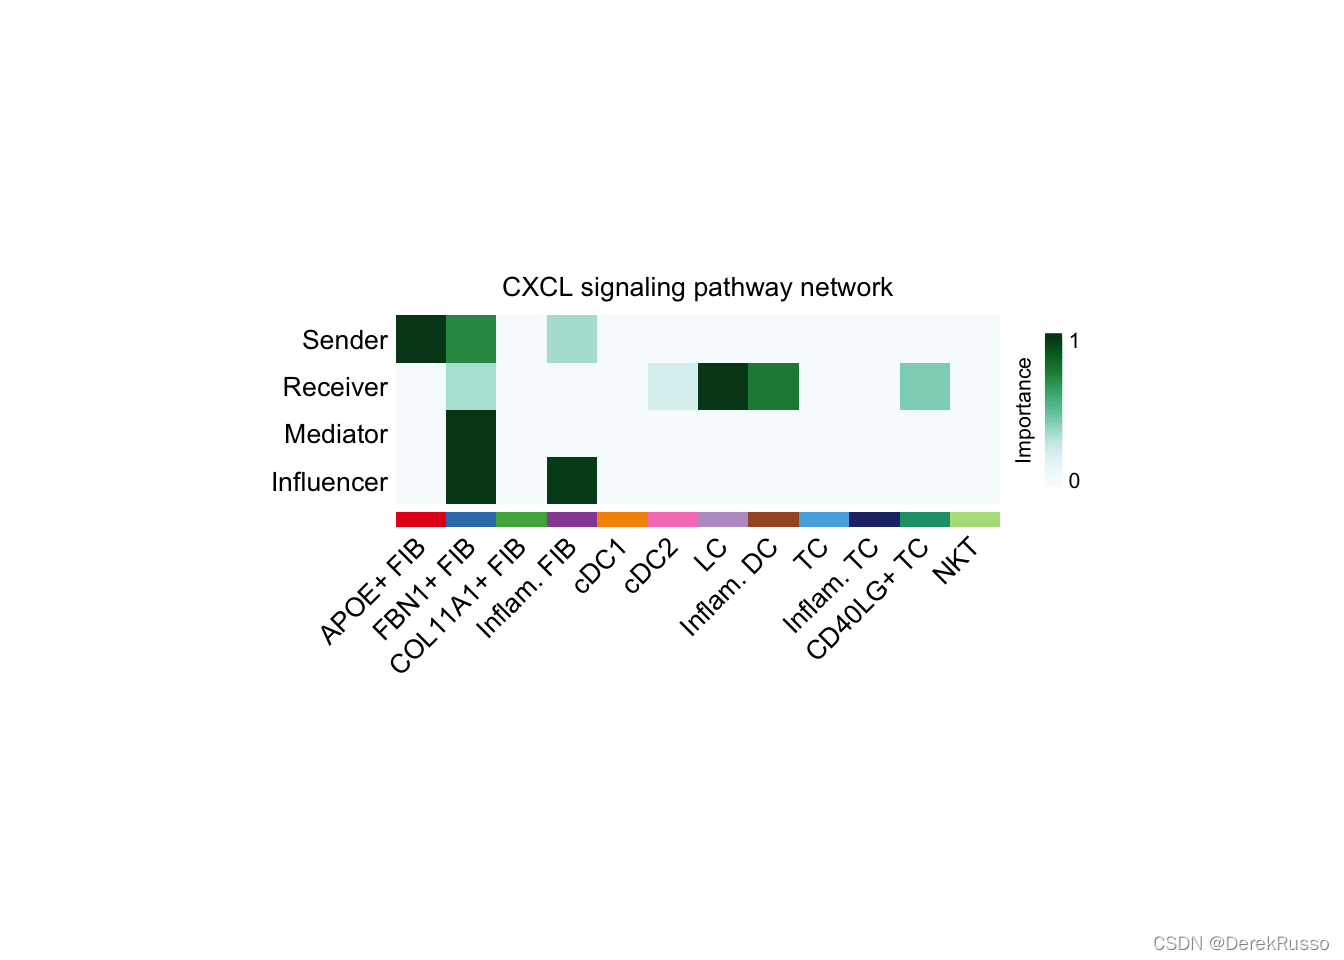
Visualize the dominant senders (sources) and receivers (targets) in a 2D space
# Signaling role analysis on the aggregated cell-cell communication network from all signaling pathways

gg1 <- netAnalysis_signalingRole_scatter(cellchat)

# Signaling role analysis on the cell-cell communication networks of interest

gg2 <- netAnalysis_signalingRole_scatter(cellchat, signaling = c("CXCL", "CCL"))

gg1 + gg2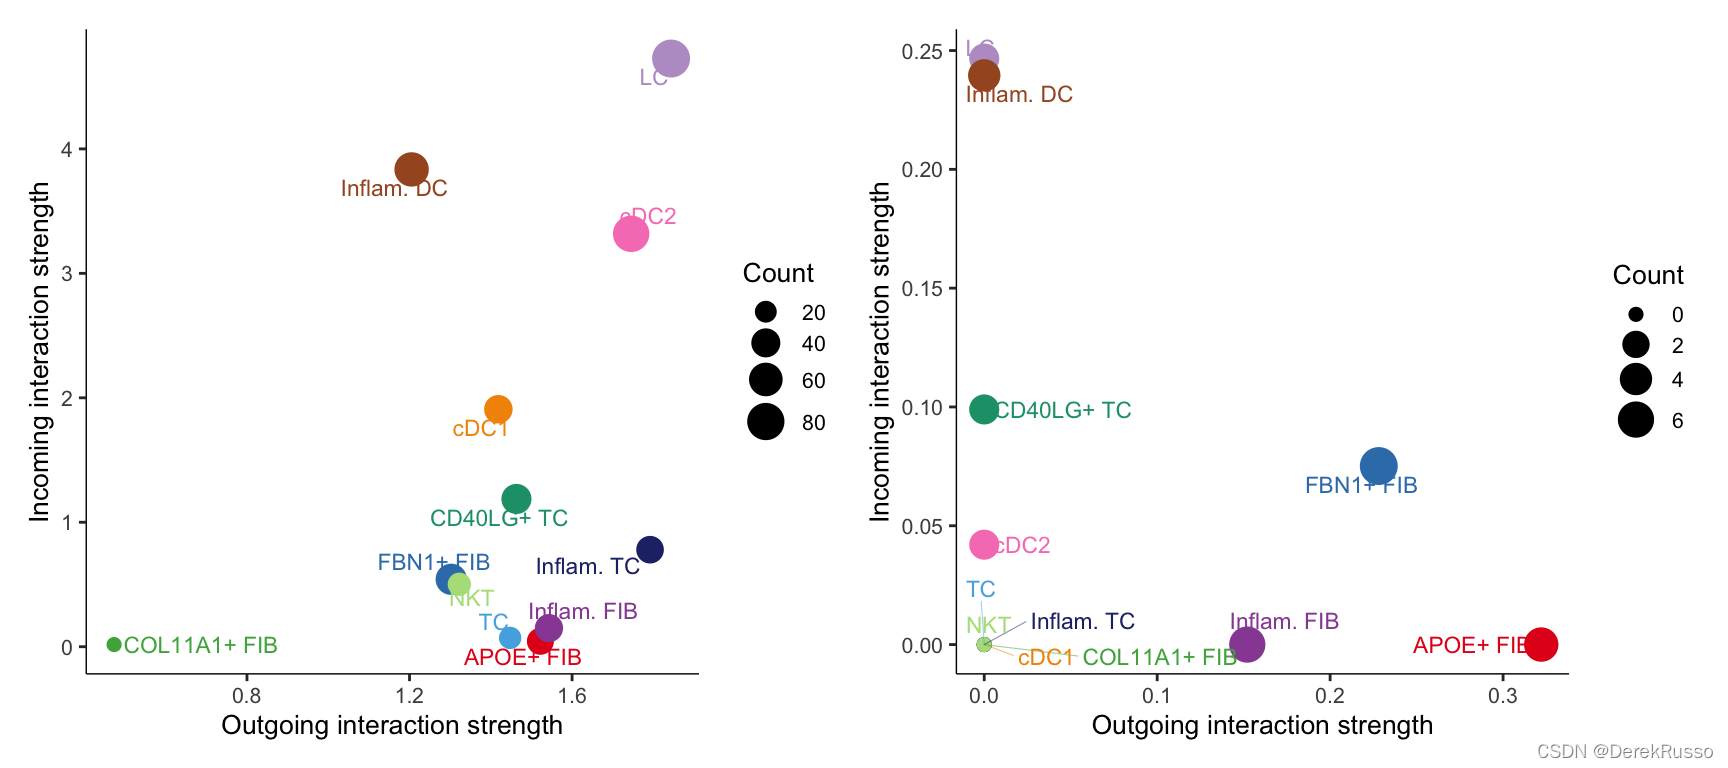
identify signals contributing most to the incoming and outgoing signalings of certain cell types
# Signaling role analysis on the aggregated cell-cell communication network from all signaling pathways

ht1 <- netAnalysis_signalingRole_heatmap(cellchat, pattern = "outgoing")
ht2 <- netAnalysis_signalingRole_heatmap(cellchat, pattern = "incoming")
ht1 + ht2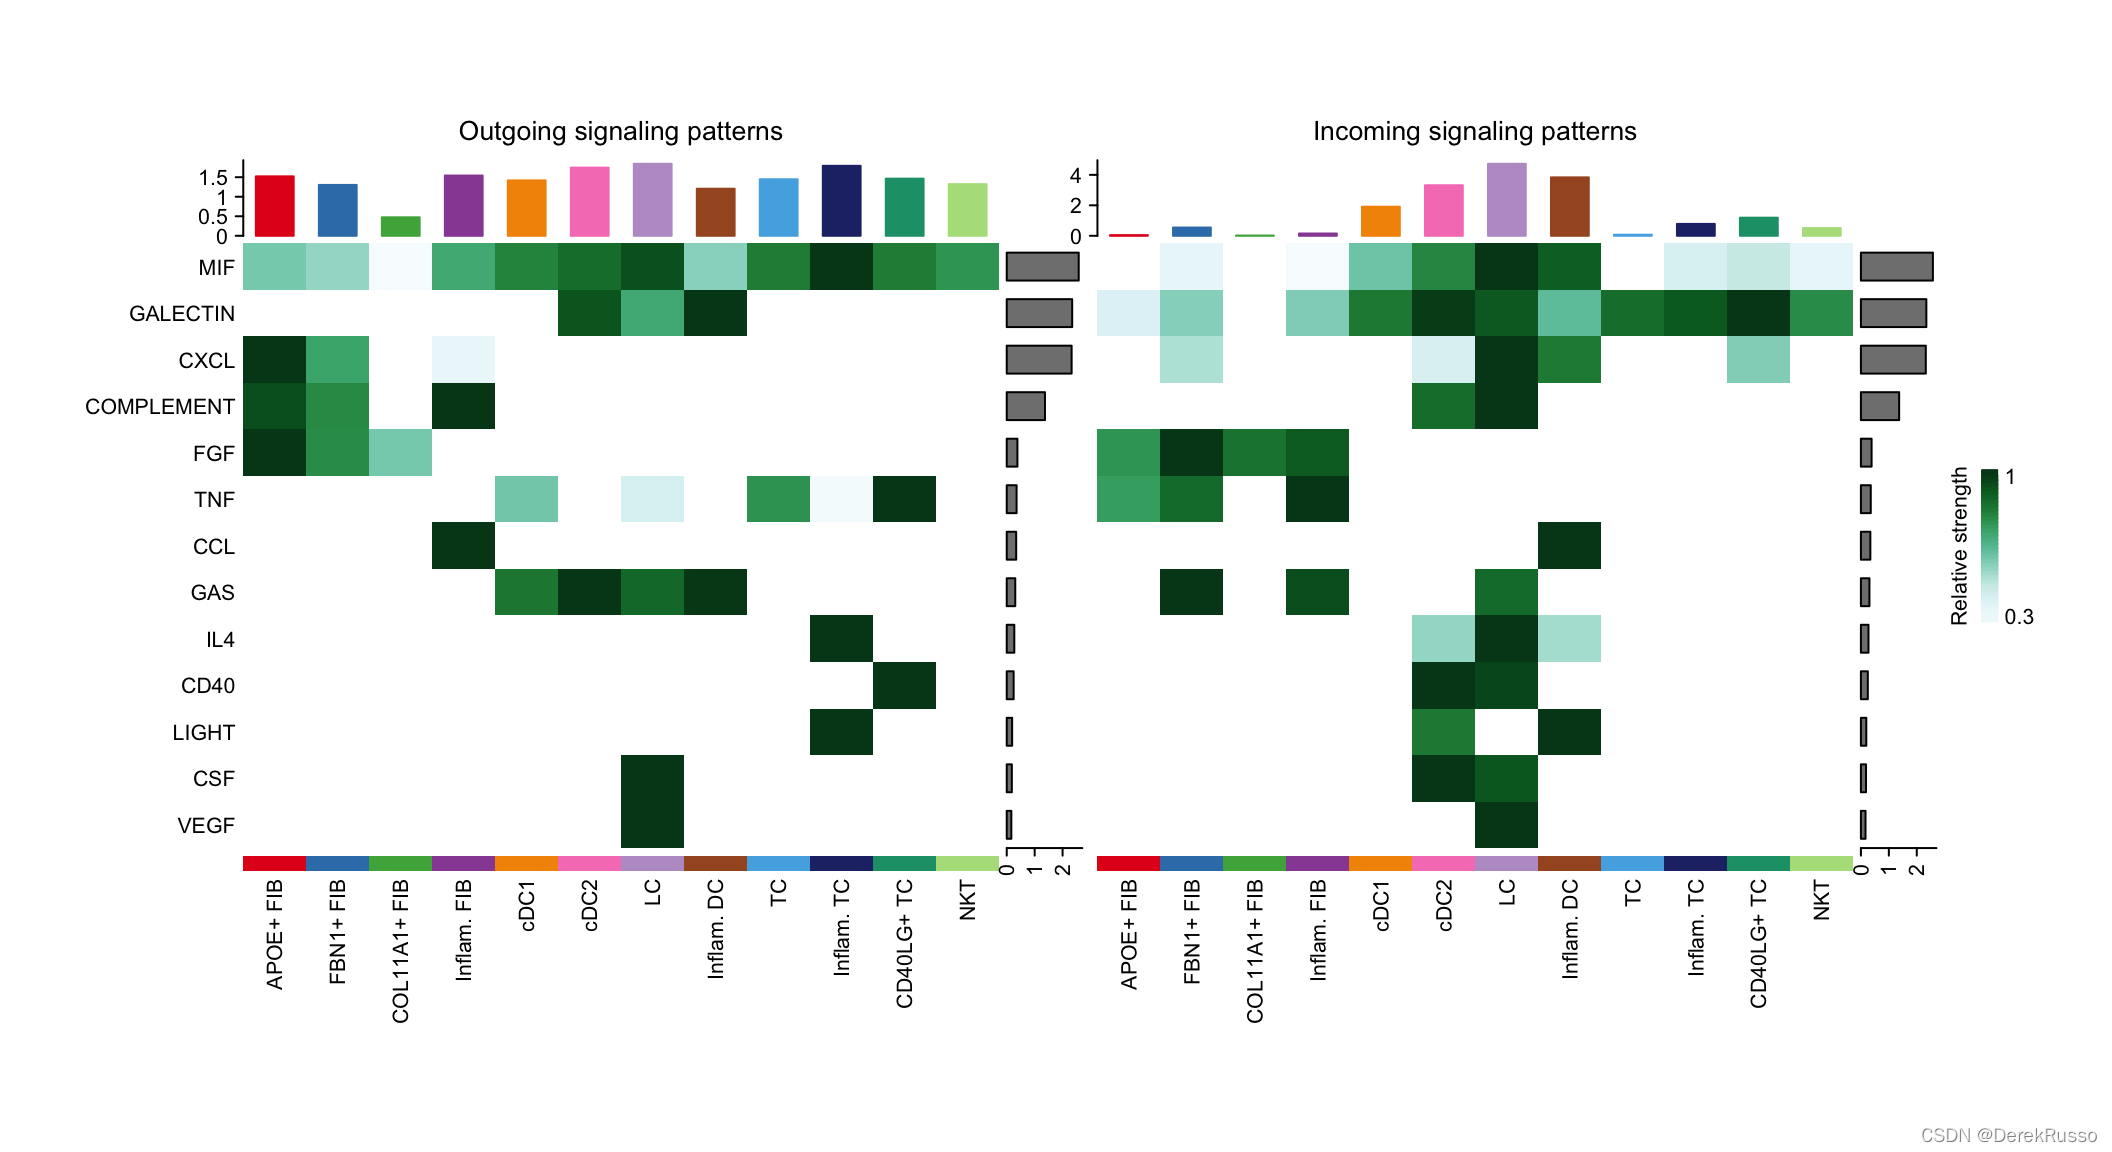
# Signaling role analysis on the cell-cell communication networks of interest
ht <- netAnalysis_signalingRole_heatmap(cellchat, signaling = c("CXCL", "CCL"))
(2)identify global communication patterns to explore how multiple cell types and signaling pathways coordinate together
default patterns number: 5;可以用select K功能寻找最佳K值,选当曲线开始突然下降时的K。
identify outgoing communication patterns of secreting cells
library(NMF)
library(ggalluvial)

selectK(cellchat, pattern = "outgoing")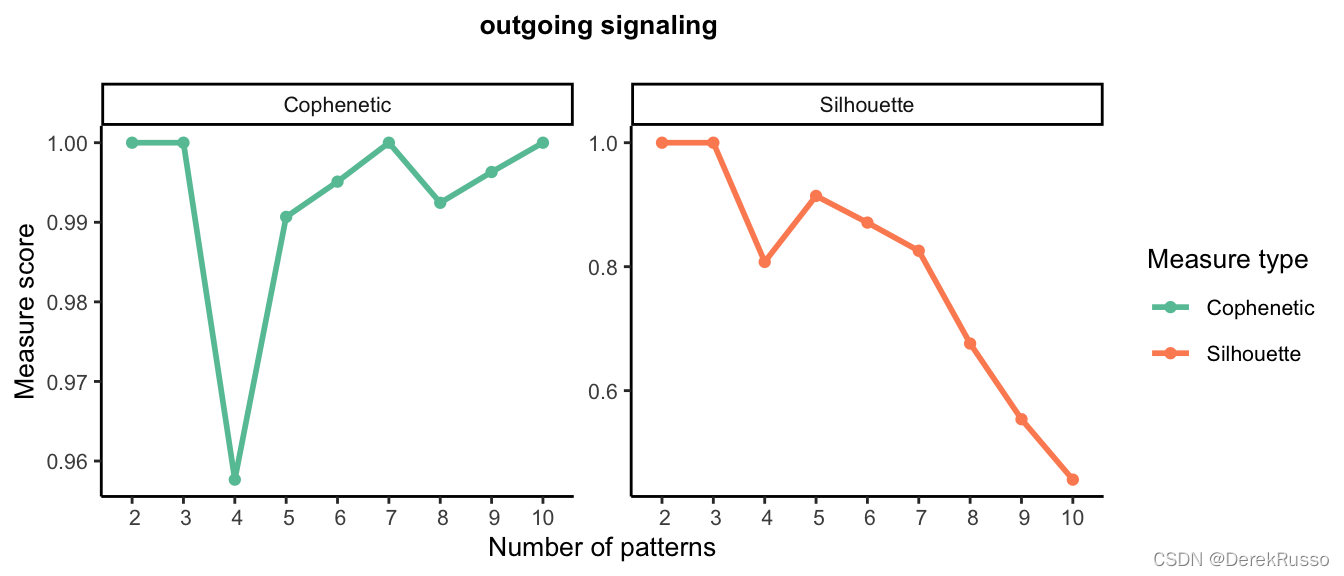
k选择3
nPatterns = 3

cellchat <- identifyCommunicationPatterns(cellchat, pattern = "outgoing", k = nPatterns)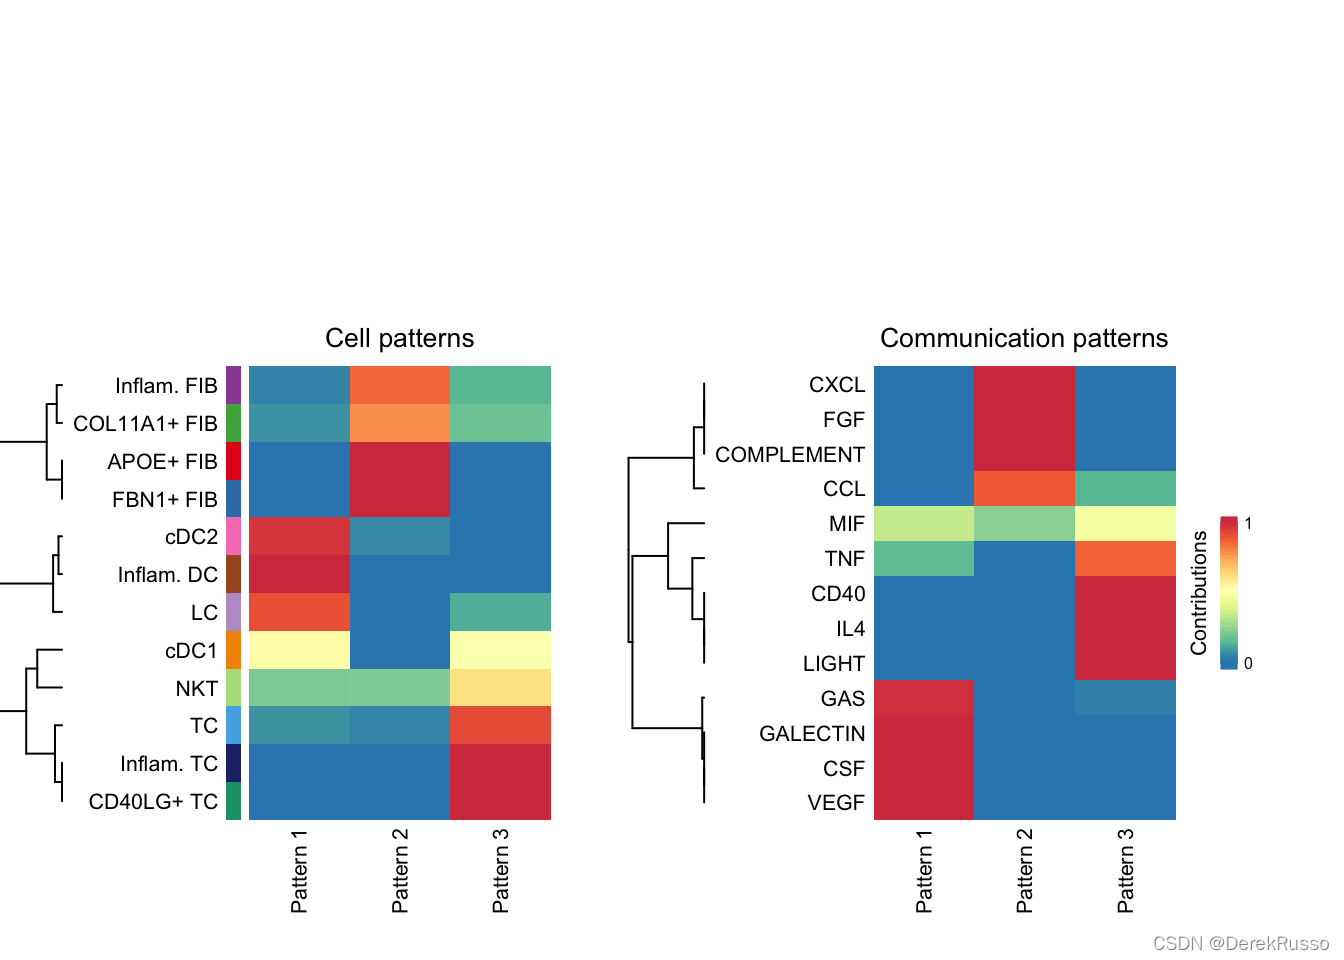
# river plot
netAnalysis_river(cellchat, pattern = "outgoing")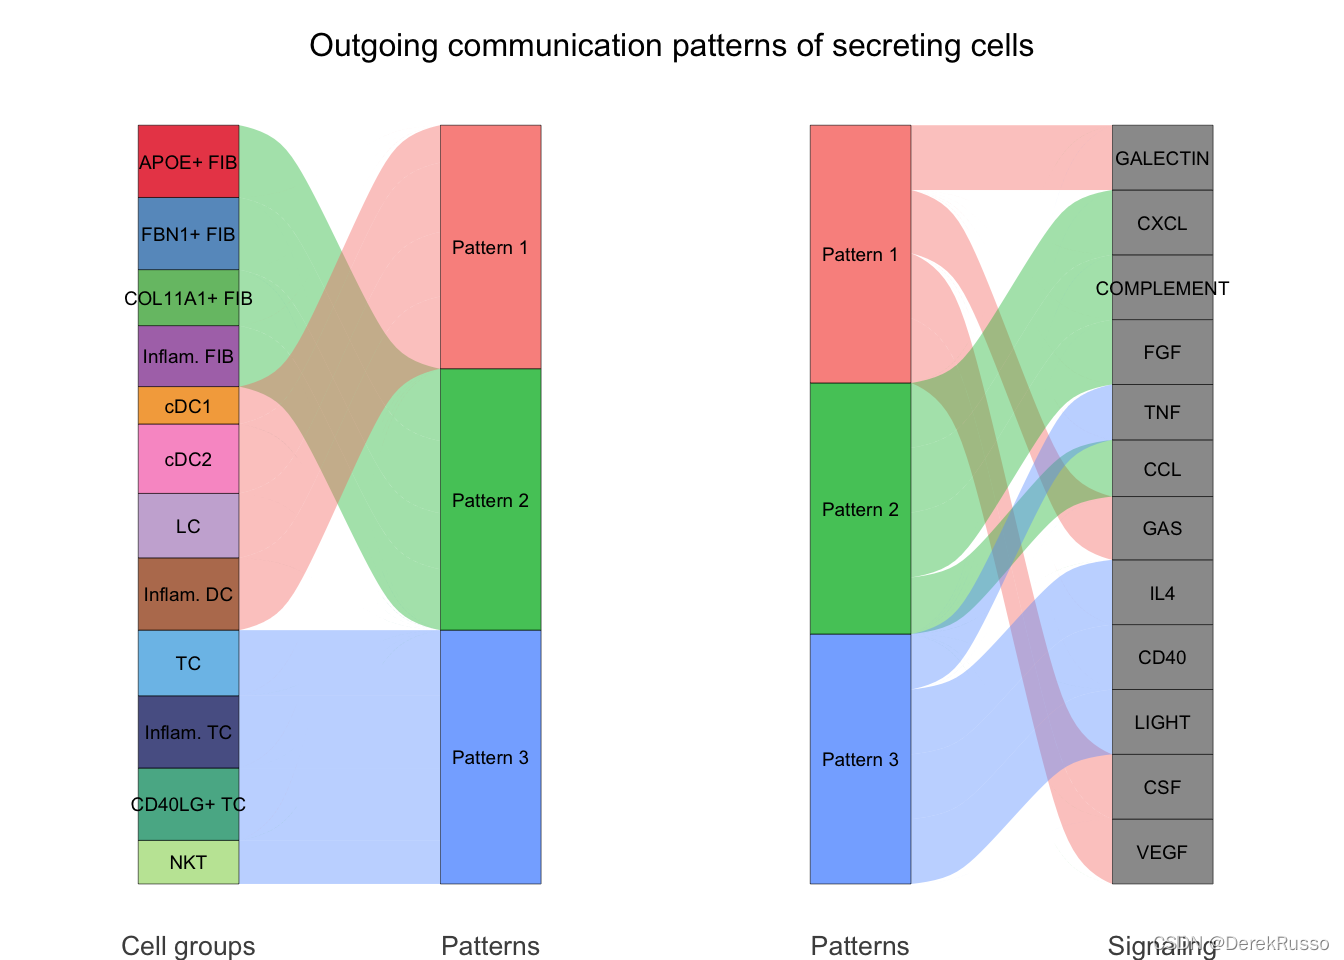
# dot plot
netAnalysis_dot(cellchat, pattern = "outgoing")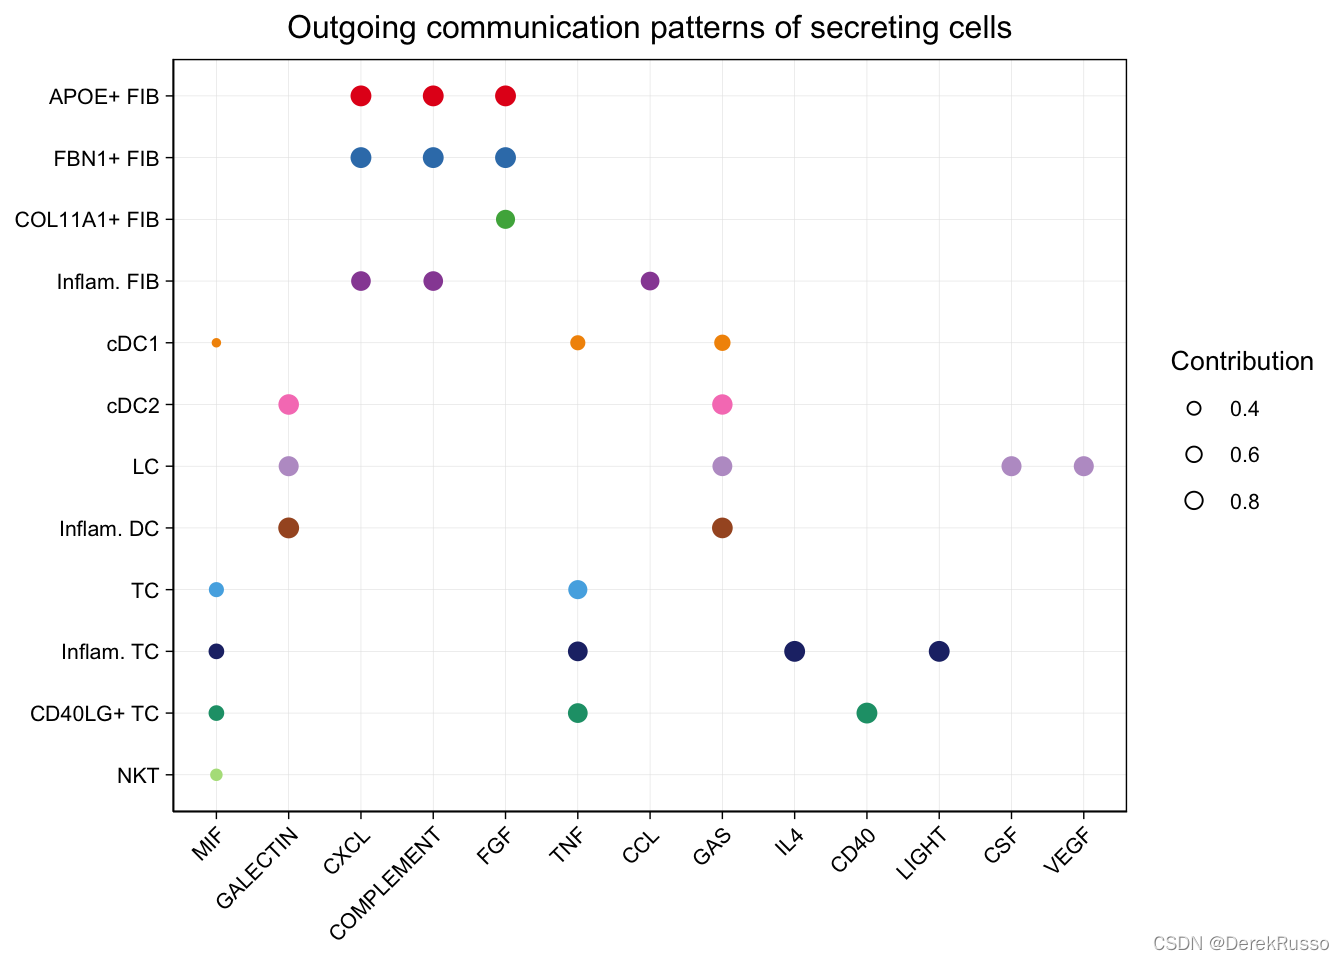
identify incoming communication patterns of target cells功能都一样,把outgoing改成incoming就行
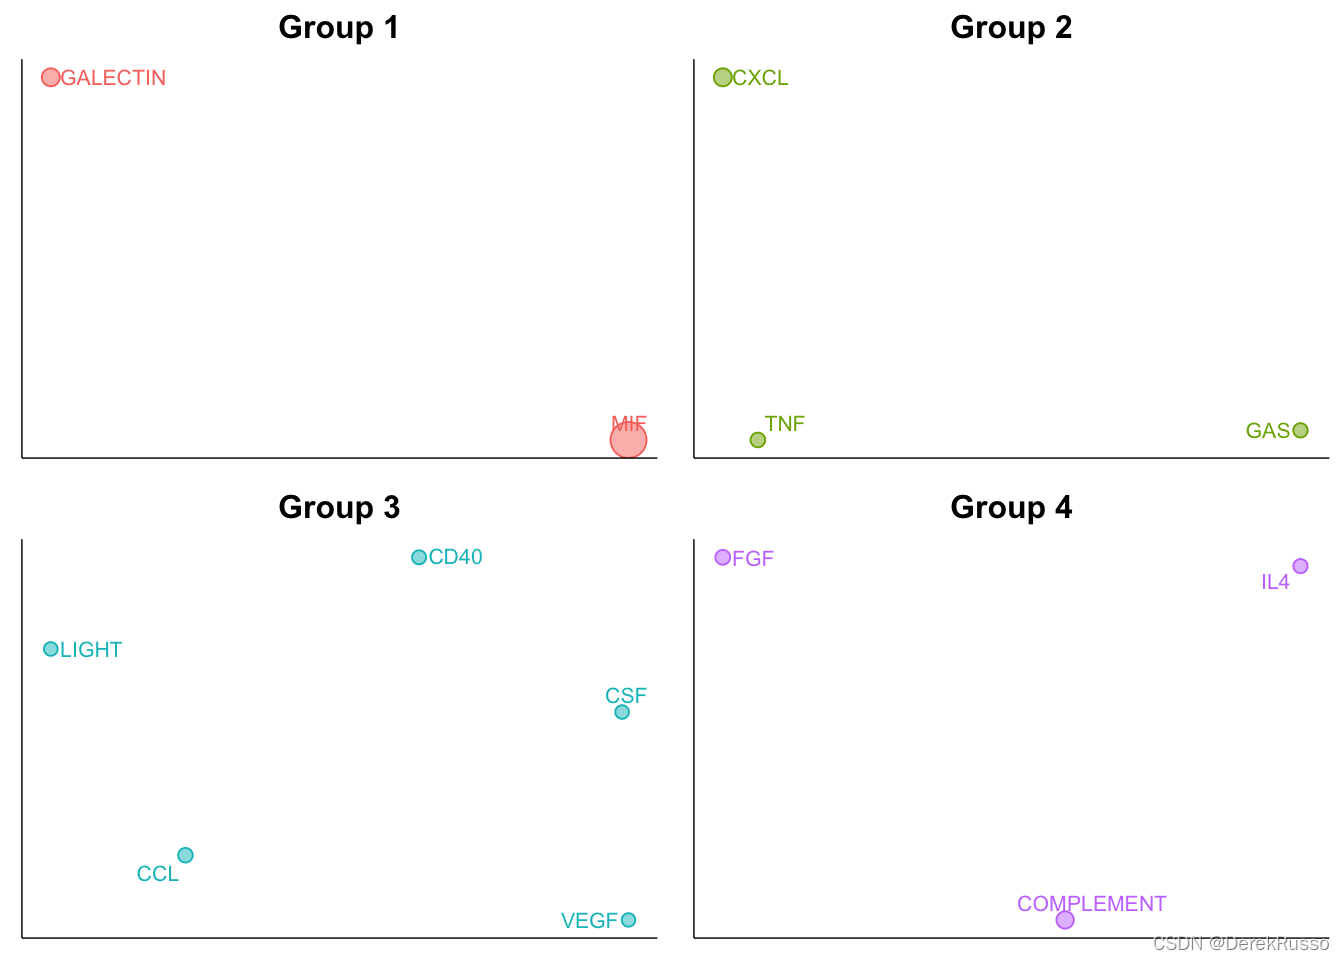
(3)manifold and classication learning analysis of signaling networks
可以对所有显著的signaling pathway进行grouping分析,依据通路之间的相似性,这种相似性既可以是功能上的“functional”,也可以是结构上的“structural”.
functional similarity: 主要的sender和receiver相同
structural similarity: 网络的结构相似,不考虑sender和receiver的相似性
identify signaling groups based on their functional similarity
cellchat <- computeNetSimilarity(cellchat, type = "functional")
cellchat <- netEmbedding(cellchat, type = "functional")


cellchat <- netClustering(cellchat, type = "functional")

# Visualization in 2D-space
netVisual_embedding(cellchat, type = "functional", label.size = 3.5)

# netVisual_embeddingZoomIn(cellchat, type = "functional", nCol = 2)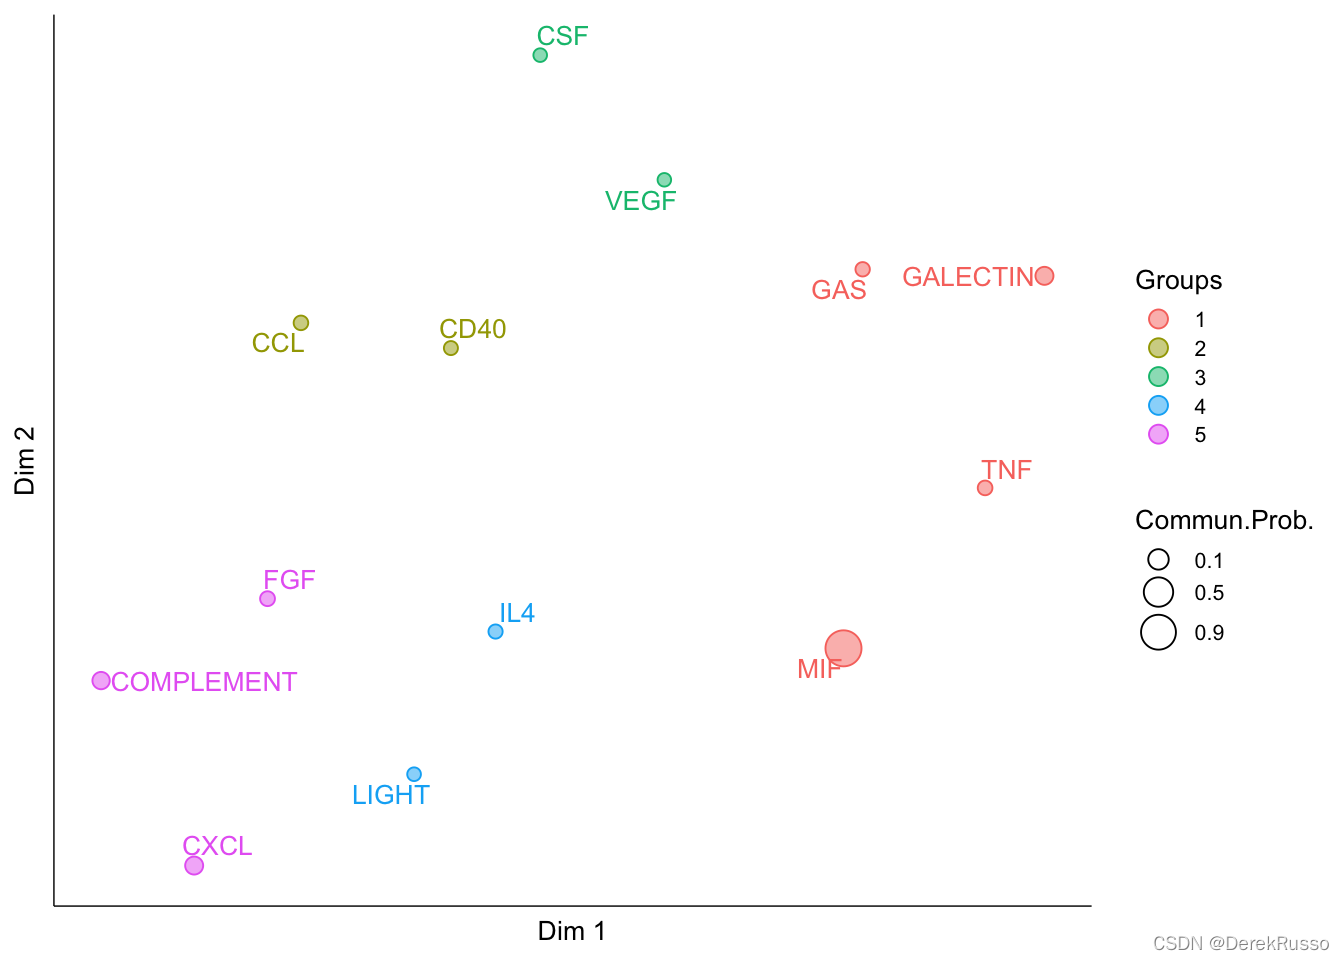
identify signaling groups based on structure similarity
cellchat <- computeNetSimilarity(cellchat, type = "structural")
cellchat <- netEmbedding(cellchat, type = "structural")

cellchat <- netClustering(cellchat, type = "structural")

# Visualization in 2D-space
netVisual_embedding(cellchat, type = "structural", label.size = 3.5)
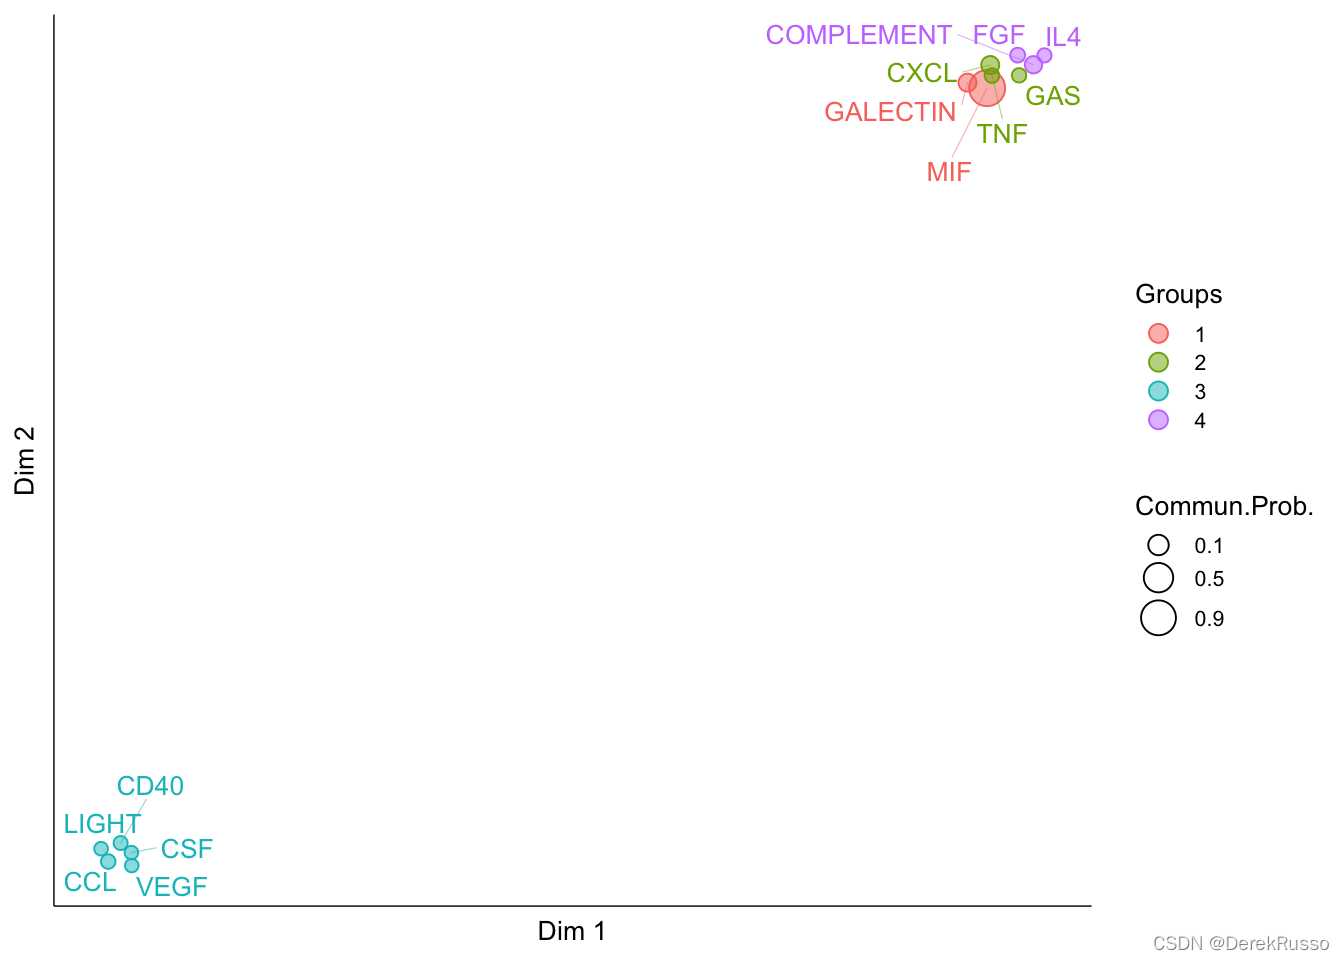
netVisual_embeddingZoomIn(cellchat, type = "structural", nCol = 2)
- part V : save the cellchat object
saveRDS(cellchat, file = "cellchat_humanSkin_LS.rds")这篇文章是关于单个dataset单个条件的,如果涉及到代表不同conditions的datasets 之间的差异分析,可以看另一个教程。


 1万+
1万+

 被折叠的 条评论
为什么被折叠?
被折叠的 条评论
为什么被折叠?
 到【灌水乐园】发言


