


 本文介绍了一种使用Python从天气预报接口获取数据,并结合城市经纬度信息,利用folium库绘制热力图的方法。通过获取北京、上海等五城市的温度数据,展示了如何将这些数据与地理位置相结合来生成直观的热力图。
在前几篇(https://zhangphil.blog.youkuaiyun.com/article/details/110358440)的基础上,通过天气预报接口读取json天气预报数据,然后取出温度值,结合城市经纬度,最终通过folium绘制热力图。python代码如下:
import json
import webbrowser as wb
import pandas as pd
import urllib
import folium
from folium.plugins import HeatMap
import numpy as np


def get_weather_data(city_code):
    url = f'http://www.weather.com.cn/data/cityinfo/{city_code}.html'
    response = urllib.request.urlopen(url)
    content = response.read().decode('utf-8')
    return content


def search_city_code(city_name):
    city_code = '-1'

    df = pd.read_json('city_code.json')
    for row in df.values:
        row_data = row[0]
        city_data = row_data['市']
        for cd in city_data:
            # print(cd['市名'], cd['编码'])
            if (city_name == cd['市名'] or cd['市名'] in city_name):
                city_code = cd['编码']
                break

    return city_code


if __name__ == '__main__':
    city_name_list = ['北京', '上海', '广州', '深圳', '成都']  # 获取以上五个城市天气数据
    temp2 = []
    for cn in city_name_list:
        city_code = search_city_code(cn)
        weather_data = get_weather_data(city_code)
        json_data = json.loads(weather_data)
        t = json_data['weatherinfo']['temp2'].strip('℃')  # 清洗数据,保留纯粹的数字
        temp2.append(float(t))

    print(temp2)

    latlngs = [[39.929986, 116.395645],  # 北京中心点经纬度
               [31.249162, 121.487899],  # 上海中心点经纬度
               [23.120049, 113.30765],  # 广州中心点经纬度
               [22.546054, 114.025974],  # 深圳中心点经纬度
               [30.679943, 104.067923]]  # 成都中心点经纬度

    temp1_ = np.expand_dims(np.array(temp2), axis=0)
    temp1_np = temp1_.reshape((5, 1))
    data = np.concatenate((latlngs, temp1_np), axis=1)

    map = folium.Map([33., 113.],  # 地图中心
                     tiles='OpenStreetMap',  # stamentoner
                     zoom_start=5)

    HeatMap(data).add_to(map)
    map.save('m.html')
    wb.open('m.html')
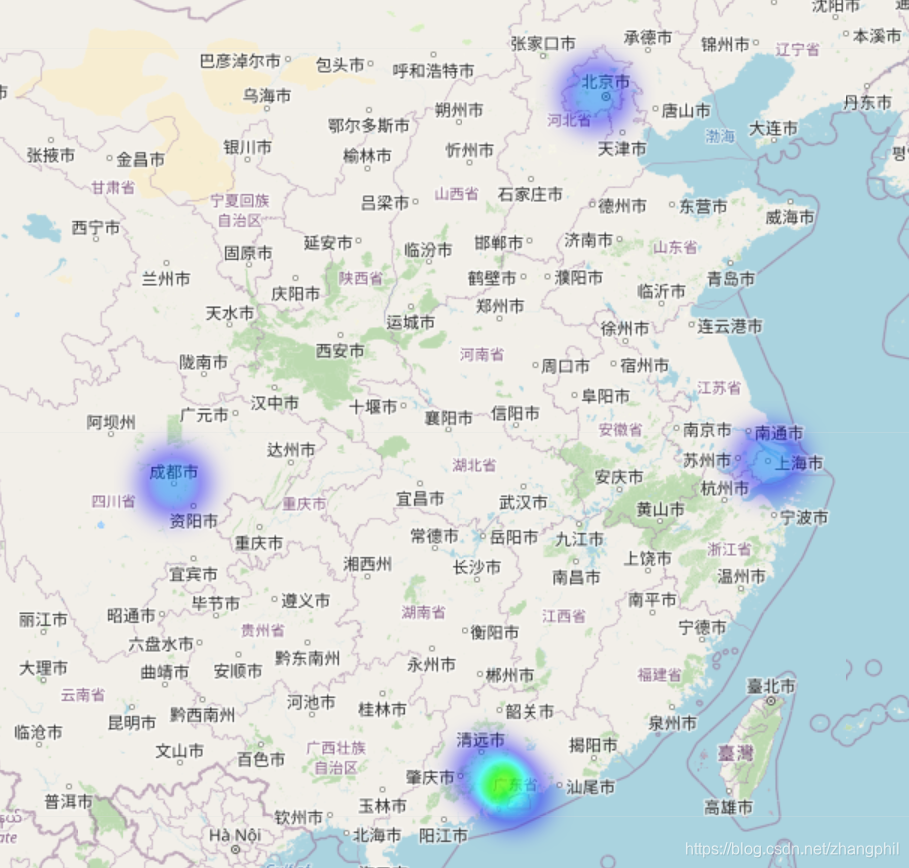
绘制的热力图如下:


 491
491


 到【灌水乐园】发言


