import numpy as np
from toolz.curried import*
@curry
defclean_nan(dataset, how='any'):return dataset.dropna(how=how)
@curry
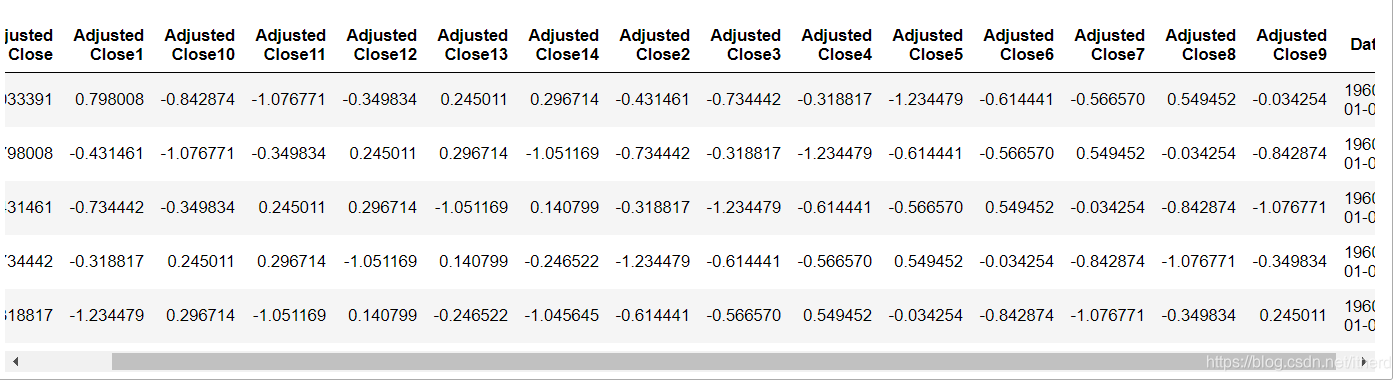
deflagger(dataset, n_lags, price_columns):
df =reduce(lambda df, lag: df.assign(**{col +str(lag): dataset[[col]].shift(-lag).values for col in price_columns}),range(1, n_lags +1),
dataset[price_columns])
result = df.assign(**{col: dataset[col]for col in dataset.drop(price_columns, axis=1).columns})return result[sorted(result.columns)]
@curry
defdiff_log_pricer(dataset, price_columns, date_column):"""
Takes the first difference of the logs of temporal data
Parameters
----------
dataset : pandas.DataFrame
A Pandas' DataFrame with a Date Column and one or many price column.
The price column must be of numerical time and not contain nones
price_columns : list of str
A list with the names of the price columns
date_column : str
The name of the date column. The column must be of type datetime.
Returns
----------
new_df : pandas.DataFrame
A df like DataFrame with the price column replaced by the log difference in time.
The first row will contain NaNs due to first diferentiation.
"""# Sorting the dataframe
sort_fn =lambda df: df.sort_values(by=date_column)# Applying log to each value
log_fn =lambda df: df.assign(**{col: np.log(df[col])for col in price_columns})# Calculating the difference
diff_fn =lambda df: df.assign(**{col:100*(df[col]- df[col].shift(1))for col in price_columns}).reset_index(drop=True)return compose(diff_fn, log_fn, sort_fn)(dataset)
@curry
deftime_split_dataset(df, train_start_date, train_end_date, holdout_end_date, date_col):"""
Splits temporal data into a training and testing datasets such that
all training data comes before the testings set.
Parameters
----------
df : pandas.DataFrame
A Pandas' DataFrame with an Identifier Column and a Date Column.
The model will be trained to predict the target column
from the features.
train_start_date : str
A date string representing a the starting time of the training data.
It should be in the same format as the Date Column in `dataset`.
Inclusive in the train set
train_end_date : str
A date string representing a the ending time of the training data.
This will also be used as the start date of the holdout period.
It should be in the same format as the Date Column in `dataset`.
Inclusive in the train set. Exclusive in the test set.
holdout_end_date : str
A date string representing a the ending time of the holdout data.
It should be in the same format as the Date Column in `dataset`.
Inclusive in the test set.
date_col : str
The name of the Date column of `dataset`.
Returns
----------
train_set : pandas.DataFrame
The in ID sample and in time training set.
test_set : pandas.DataFrame
The out of time testing set.
"""
train_set = df.copy()[(df[date_col]>= train_start_date)&(df[date_col]<= train_end_date)]
test_set = df.copy()[(df[date_col]> train_end_date)&(df[date_col]<= holdout_end_date)]return train_set, test_set
# coding=utf-8import tensorflow as tf
from tensorflow.keras.models import Sequential
from tensorflow.keras.layers import Dense, LSTM
from tensorflow.keras.optimizers import Adam
defqrnn_learner(dataset, price_cols, target_col, prediction_col="prediction",
tau=0.05, neurons=20, lr=1e-4, batch_size=512, epochs=5):defto_3D(dataset):
all_p_columns = pipe(dataset.columns,filter(lambda col:reduce(lambda acc, p_col: acc or col.find(p_col)>=0,
price_cols,False)),filter(lambda col: col != target_col),list)defp(new_data):return new_data[all_p_columns].values.reshape(-1,int(len(all_p_columns)/len(price_cols)),len(price_cols))return p, p(dataset)defquantile_loss(y_true, y_pred):
ro = tau - tf.cast(tf.greater(y_pred, y_true), tf.float32)return tf.reduce_mean(ro *(y_true - y_pred))
_3Dnator, x_train = to_3D(dataset)
y_train = dataset[[target_col]].values
n_samples, timesteps, n_vars = x_train.shape
# build model
model = Sequential()
model.add(LSTM(neurons, input_shape=(timesteps, n_vars)))
model.add(Dense(1, activation=None))
opt = Adam(lr=lr)
model.compile(loss=quantile_loss, optimizer=opt)# train model
model.fit(x_train, y_train, batch_size=batch_size, epochs=epochs, verbose=0)defp(new_dataset):
x_new = _3Dnator(new_dataset)return new_dataset.assign(**{prediction_col: model.predict(x_new)})return p, p(dataset)
example
from matplotlib import pyplot as plt
plt.style.use("ggplot")
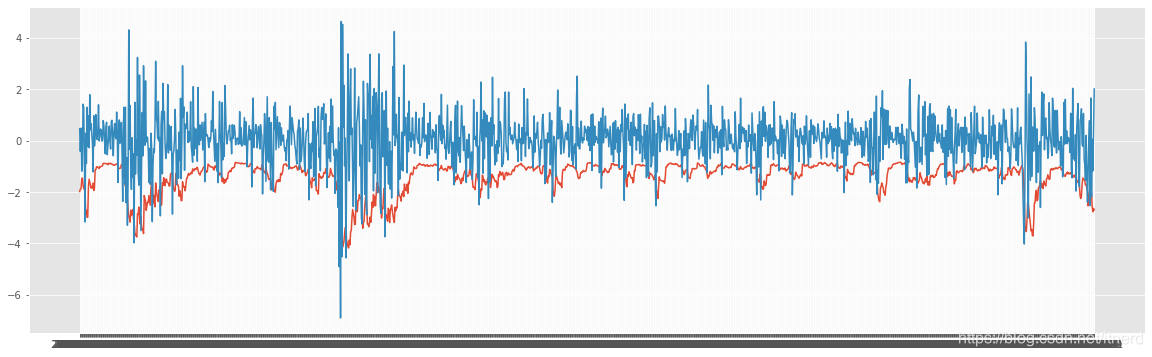
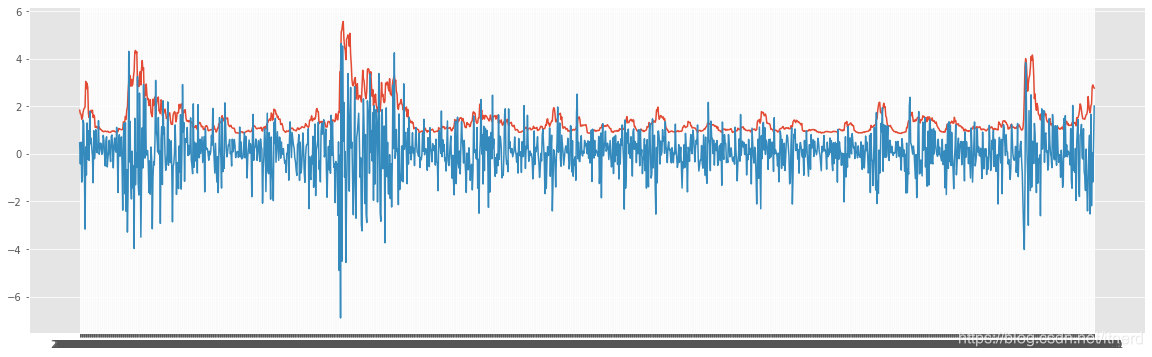
tau =0.95
N_LAGS=14
PRICE_COLS =["Adjusted Close"]
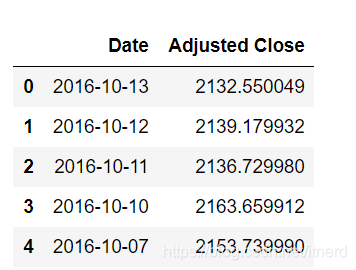
data = pd.read_csv('SP500.csv', usecols=['Adjusted Close','Date'])
data.head()
var_estimator, train_pred = qrnn_learner(train, price_cols=PRICE_COLS, target_col="Adjusted Close14", epochs=10, lr=1e-3, tau= tau)
test_pred = var_estimator(test)
quantile_eval_fn = quantile_loss_evaluator(predict_col="prediction",
target_col="Adjusted Close14",
tau= tau)
hits_eval_fn = proportion_of_hits_evaluator(predict_col="prediction",
target_col="Adjusted Close14")print("Quantile loss on train %f and test %f sets"%tuple(map(quantile_eval_fn,[train_pred, test_pred])))print("Number of hits on train %f and test %f sets"%tuple(map(hits_eval_fn,[train_pred, test_pred])))"""
Quantile loss on train 0.094278 and test 0.091880 sets
Number of hits on train 0.941602 and test 0.940397 sets
"""
plt.figure(figsize=(20,6))
plt.plot(test_pred["Date"], test_pred["prediction"])
plt.plot(test_pred["Date"], test_pred["Adjusted Close14"])


 1838
1838

 被折叠的 条评论
为什么被折叠?
被折叠的 条评论
为什么被折叠?
 到【灌水乐园】发言


