


 本文对比了Matplotlib中两种创建子图的方法:add_subplot和subplot。通过实例代码展示了如何使用这两种方法来创建并绘制不同类型的图表,帮助读者理解其工作原理及适用场景。
参考了几篇博客,在这里做下总结:
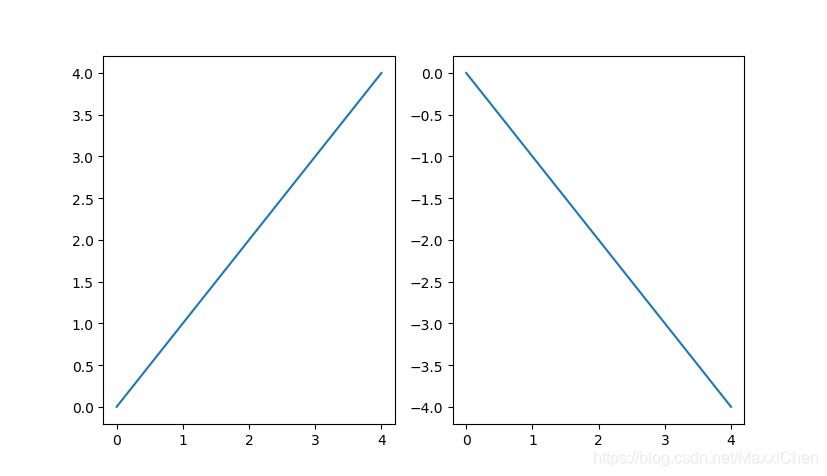
add_subplot 需要创建实例fig,并且在fig实例的基础上添加子画布:
x = np.arange(5)

fig = plt.figure()
axes = fig.add_subplot(121)
axes.plot(x,x)
axes = fig.add_subplot(122)
axes.plot(x,-x)
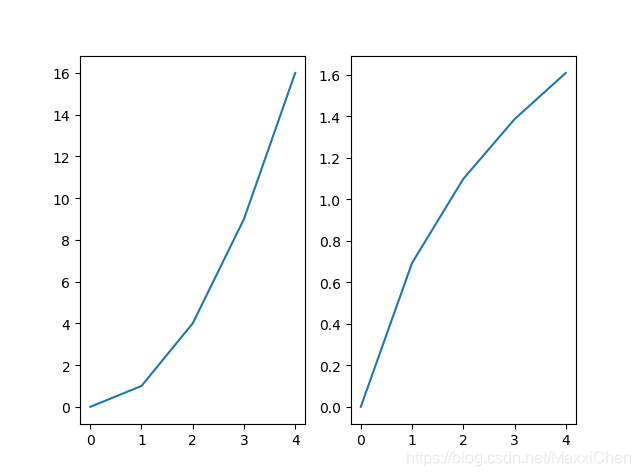
而subplot无需创建实例,使用方法为:
x = np.arange(5)

plt.subplot(121)
plt.plot(x,x**2)

plt.subplot(122)
plt.plot(x,np.log(x+1))


 1355
1355

 被折叠的 条评论
为什么被折叠?
被折叠的 条评论
为什么被折叠?
 到【灌水乐园】发言


