


 本文总结了如何使用ListedColormap和plt.scatter()结合,通过自定义颜色库来生成散点图。介绍了 ListedColormap 的用法,包括使用十六进制颜色码定义颜色库,以及plt.scatter()的关键参数如x、y、s、c、cmap等。通过实例展示了如何根据数据值映射到自定义颜色库,生成个性化散点图。
看了几篇关于scatter()和ListedColormap的用法文章,这里做下总结,如何用自己想要的colormap做出想要的散点图。
1.ListedColormap允许用户使用十六进制颜色码来定义自己所需的颜色库,并作为plt.scatter()中的cmap参数出现:
例子
# 定义了一个顺序为(255,0,0),(0,255,0),(0,0,255)的颜色库
colormap = ListedColormap(['#FF0000','#00FF00','#0000FF'])
2.plt.scatter()用法:
matplotlib.pyplot.scatter(x, y, s=None, c=None, marker=None, cmap=None, norm=None, vmin=None, vmax=None, alpha=None, linewidths=None, verts=None, edgecolors=None, *, data=None, **kwargs)
其中
x,y表示所要绘制的散点数据
s代表散点大小
c表示的可以是
- A single color format string.(比如‘red’)
- A sequence of color specifications of length n.(比如['blue','yellow','green','red']),sequence中的元素与散点一一对应
- A sequence of n numbers to be mapped to colors using cmap and norm.其中number可以是任意数字,根据number大小,一一对应cmap中的十六进制颜色编码
cmap表示使用的颜色库,当且仅当c以number且格式匹配数据表示时会被访问到
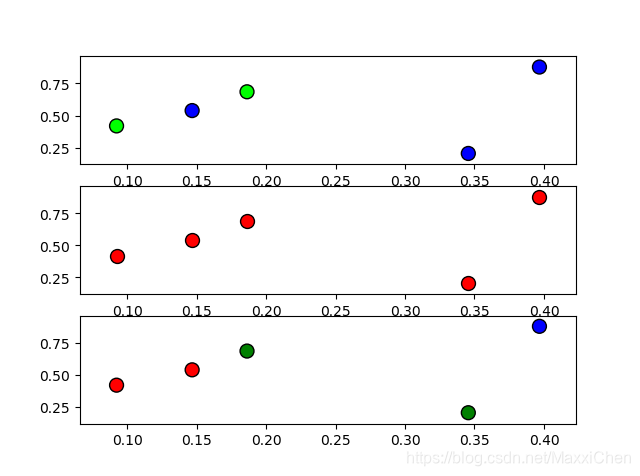
3.实例:
import numpy as np
import matplotlib.pyplot as plt
from matplotlib.colors import ListedColormap

plt.subplot(311)
colormap = ListedColormap(['#00FF00','#FF0000','#0000FF'])
np.random.seed(1)
colors = np.random.randint(3,6,size=5)
x,y = np.random.rand(5),np.random.rand(5)

plt.scatter(x, y, s=100, c=colors,cmap=colormap,edgecolors='black')

plt.subplot(312)
plt.scatter(x, y, s=100, c='r',edgecolors='black')

plt.subplot(313)
colors = ['r','r','g','g','b']
plt.scatter(x, y, s=100, c=colors,edgecolors='black')
结果:


 1628
1628

 被折叠的 条评论
为什么被折叠?
被折叠的 条评论
为什么被折叠?
 到【灌水乐园】发言


