


 该博客介绍了如何解析Kitti数据集中的bin二进制点云数据,并通过numpy转换为数组格式,然后利用open3d库进行三维可视化。代码示例展示了两种读取点云数据的方法,最终通过open3d显示点云效果。
数据描述
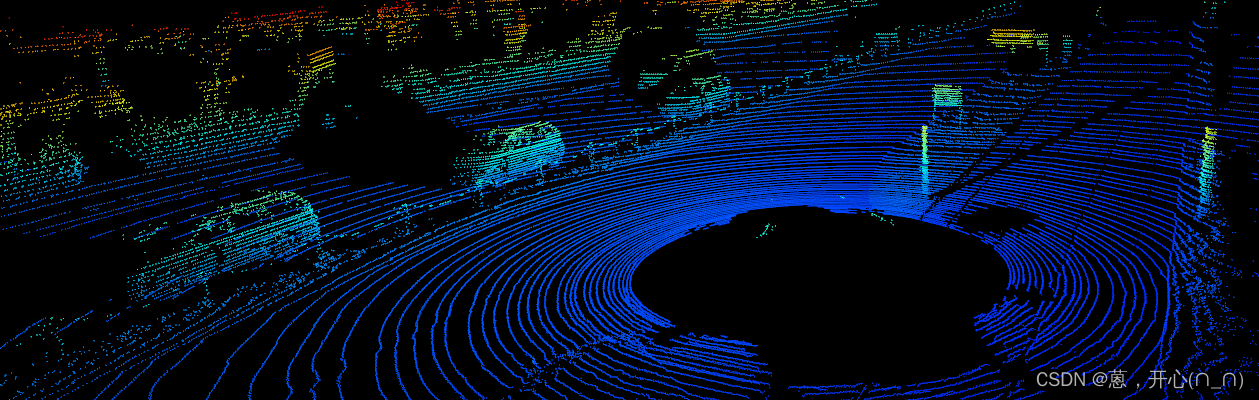
kitti数据集提供了bin二进制格式的点云数据,想可视化看看效果,首先解析二进制文件,转为numpy格式,再使用open3d进行可视化。也可以用numpy直接读取二进制文件。
效果如下:
代码
两种方法读取点云数据
点云数据保存在.bin数据中,可分别用struct库和numpy读取,感觉numpy更好理解一点,原始数据中,保存了x,y,z,r三个维度,因此numpy读完以后需要reshape成4维,可视化的时候选取
x,y,z三维即可。
import numpy as np
import struct
import open3d

def read_bin_velodyne(path):
    '''read bin file and transfer to array data'''
    pc_list=[]
    with open(path,'rb') as f:
        content=f.read()
        pc_iter=struct.iter_unpack('ffff',content)
        for idx,point in enumerate(pc_iter):
            pc_list.append([point[0],point[1],point[2]])
    return np.asarray(pc_list,dtype=np.float32)

def main():
    pc_path='/KITTI_DATASET_ROOT/testing/velodyne/000045.bin'
    # example=read_bin_velodyne(pc_path)
    example = np.fromfile(pc_path, dtype=np.float32, count=-1).reshape(-1, 4)
    example_xyz=example[:,:3]
    example_xyz=example_xyz[example_xyz[:,2]>-3]

    # From numpy to Open3D
    pcd = open3d.open3d.geometry.PointCloud()
    pcd.points= open3d.open3d.utility.Vector3dVector(example_xyz)
    vis_ = open3d.visualization.Visualizer()
    vis_.create_window()
    vis_.add_geometry(pcd)
    render_options = vis_.get_render_option()
    render_options.point_size = 1
    render_options.background_color = np.array([0, 0, 0])
    vis_.run()
    vis_.destroy_window()
    # pcd.points= open3d.open3d.utility.Vector3dVector(example)
    # open3d.open3d.visualization.draw_geometries([pcd])

if __name__=="__main__":
    main()


 958
958

 被折叠的 条评论
为什么被折叠?
被折叠的 条评论
为什么被折叠?
 到【灌水乐园】发言


