


可视化框架概述
CellChat提供四大类可视化工具:
- 层次图(Hierarchy plot)
- 圆形图(Circle plot)
- 弦图(Chord diagram)
- 气泡图(Bubble plot)
这些工具从不同角度展示细胞通讯网络,支持从整体通路到单个配体-受体对的多层次分析。
一、使用层次图、圆图或弦图进行可视化
这里我们以输入一条信号通路为例进行说明。所有显示出显著细胞通讯的信号通路都可以通过 cellchat@netP$pathways 来获取。
(首先借助 @ 操作符从 cellchat 这个 S4 对象中提取 netP 槽位的数据,接着使用 $ 操作符从 netP 所代表的数据里提取 pathways 元素)
1、选择要展示的信号通路
pathways.show <- c("CXCL") 定义字符向量pathways.show,其值为“CXCL”,在CellChat分析中,可能存在多个信号通路,但这里仅选取了CXCL信号通路用于后续的可视化分析。CXCL是一类趋化因子信号通路,在细胞迁移、免疫反应等生理过程中发挥着重要作用。
2、绘制层次图:
# Hierarchy plot
# Here we define `vertex.receive` so that the left portion of the hierarchy plot shows signaling to fibroblast and the right portion shows signaling to immune cells
vertex.receiver = seq(1,4) # a numeric vector.
netVisual_aggregate(cellchat, signaling = pathways.show,  vertex.receiver = vertex.receiver)
seq(1, 4)函数会生成一个从 1 到 4 的连续整数序列,这个序列被赋值给vertex.receiver。在CellChat的可视化中,vertex.receiver参数用于指定接收信号的细胞类型在图中的位置和分组。这里通过设置vertex.receiver,目的是让层次图的左侧部分展示向成纤维细胞(fibroblast)的信号传递,右侧部分展示向免疫细胞(immune cells)的信号传递。netVisual_aggregate是CellChat包中的一个函数,用于对细胞间通讯结果进行聚合可视化。cellchat:这是一个CellChat对象,它包含了细胞间通讯分析的所有结果,如细胞类型、信号通路强度等信息。signaling = pathways.show:指定要可视化的信号通路,这里使用之前定义的pathways.show,即只对CXCL信号通路进行可视化。vertex.receiver = vertex.receiver:传递前面定义的接收细胞类型的索引向量,以此控制层次图的布局。
绘制圆形图:
# Circle plot
par(mfrow=c(1,1))
netVisual_aggregate(cellchat, signaling = pathways.show, layout = "circle")par函数用于设置图形参数,mfrow参数用于指定图形的布局方式。c(1, 1)表示将图形布局设置为 1 行 1 列,即只显示一个图形。这一步通常是为了确保后续的圆形图能够单独显示,不受之前图形布局的影响。- 再次调用
netVisual_aggregate函数进行可视化,但这次设置layout = "circle",表示使用圆形布局来展示CXCL信号通路的细胞间通讯结果。圆形图可以更直观地展示细胞类型之间的相互通讯关系,每个细胞类型通常用一个节点表示,节点之间的连线表示细胞间的通讯信号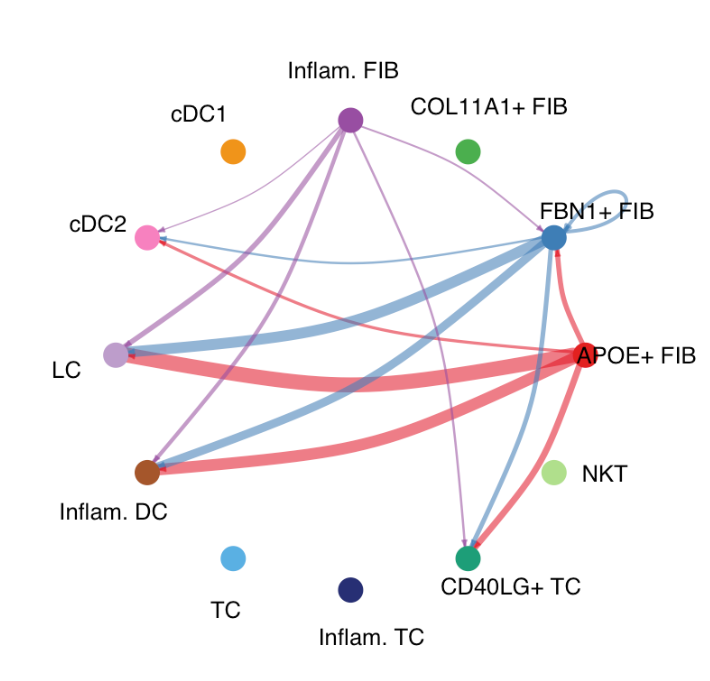
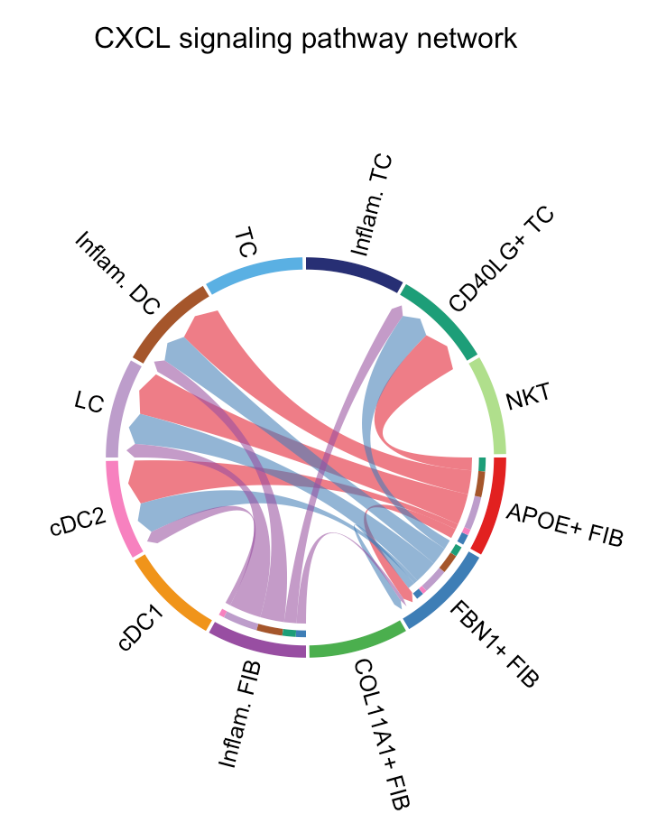
绘制和弦图:
# Chord diagram
par(mfrow=c(1,1))
netVisual_aggregate(cellchat, signaling = pathways.show, layout = "chord")
par 函数用于设置图形的参数,mfrow 用于指定图形的布局方式。c(1, 1) 表示将图形布局设置为 1 行 1 列,即只显示一个图形。这一步确保弦图会单独显示,不会受到之前图形布局的影响。
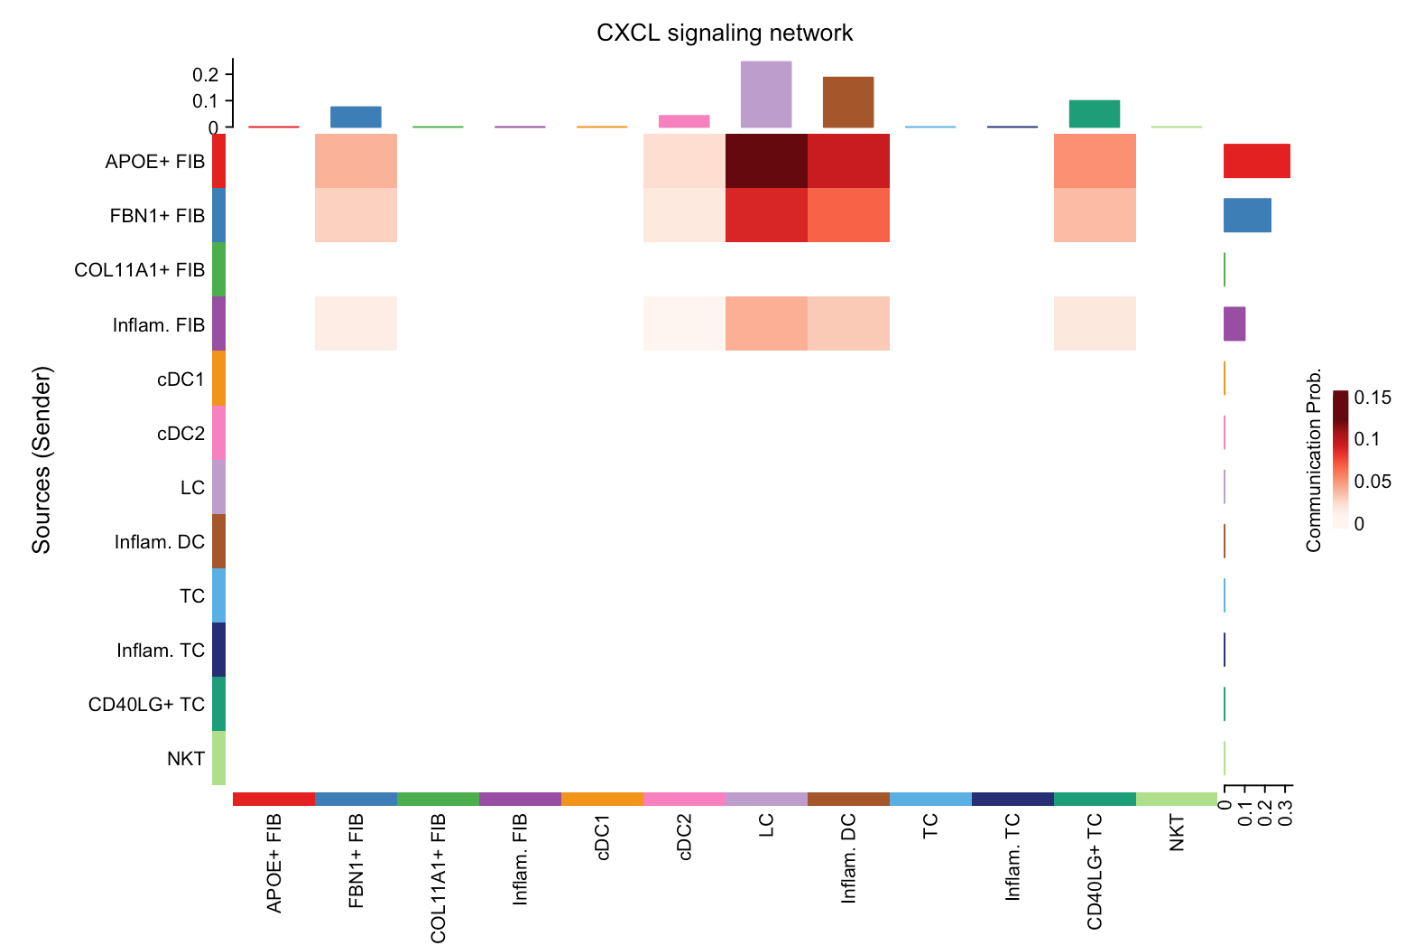
绘制热图:
# Heatmap
par(mfrow=c(1,1))
netVisual_heatmap(cellchat, signaling = pathways.show, color.heatmap = "Reds")
#> Do heatmap based on a single object
同样,这行代码将图形布局设置为 1 行 1 列,保证热图单独显示。
netVisual_heatmap是CellChat包中专门用于绘制热图的函数,用于展示细胞间通讯的强度。cellchat:依旧是包含细胞间通讯分析结果的CellChat对象。signaling = pathways.show:指定要可视化的信号通路为CXCL信号通路。color.heatmap = "Reds":设置热图的颜色方案为红色系。在热图中,不同的颜色深浅表示不同的通讯强度,红色系通常用于突出显示较强的通讯关系。
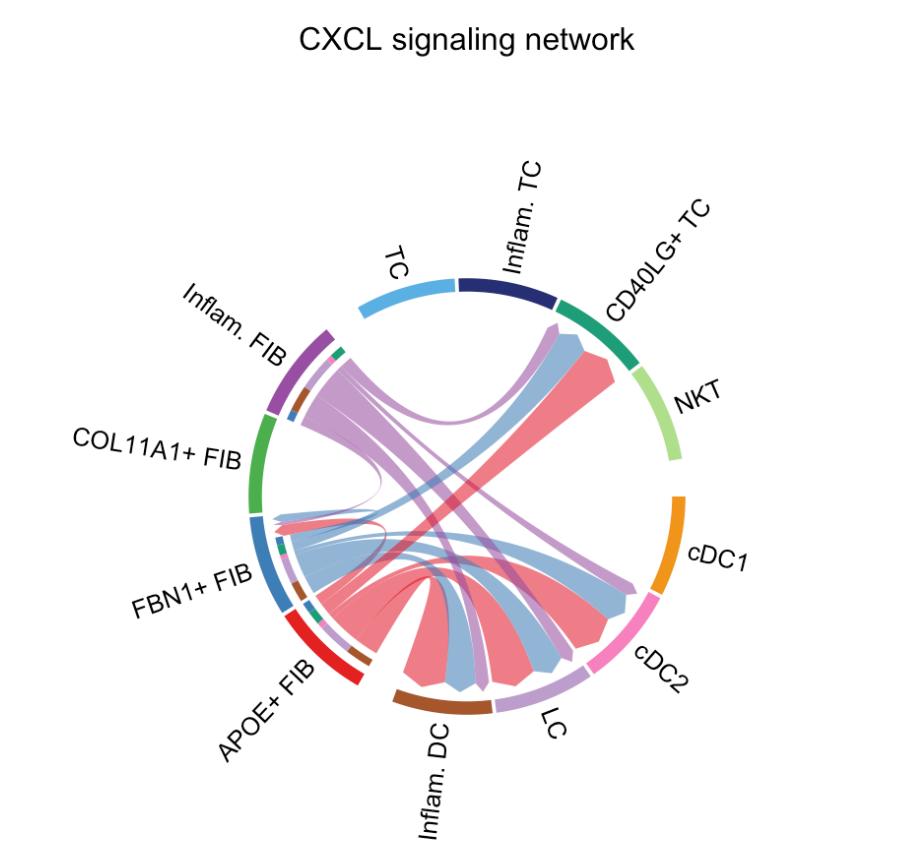
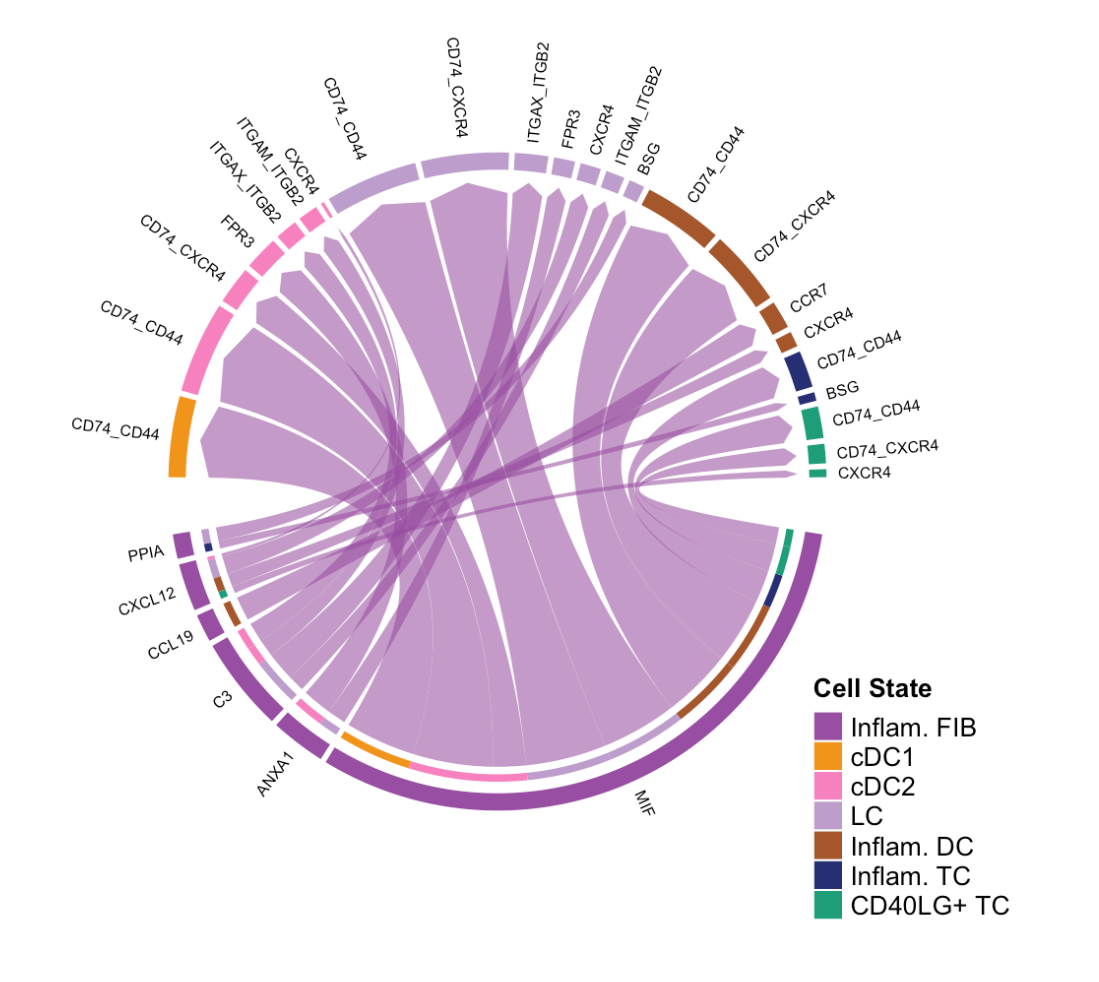
# Chord diagram
group.cellType <- c(rep("FIB", 4), rep("DC", 4), rep("TC", 4)) # grouping cell clusters into fibroblast, DC and TC cells
names(group.cellType) <- levels(cellchat@idents)
netVisual_chord_cell(cellchat, signaling = pathways.show, group = group.cellType, title.name = paste0(pathways.show, " signaling network"))
#> Plot the aggregated cell-cell communication network at the signaling pathway level
rep("FIB", 4)表示重复字符串"FIB"4 次,同理,rep("DC", 4)和rep("TC", 4)分别重复"DC"和"TC"4 次。c(...)函数将这些重复的字符串组合成一个向量。最终,group.cellType向量包含了 12 个元素,前 4 个为"FIB",中间 4 个为"DC",最后 4 个为"TC"。这里的"FIB"代表成纤维细胞(fibroblast),"DC"代表树突状细胞(dendritic cell),"TC"代表 T 细胞(T cell),这一步是将细胞聚类分组到这三种主要的细胞类型中。cellchat@idents是CellChat对象中的一个槽,通常包含每个细胞的聚类标签。levels(cellchat@idents)返回这些聚类标签的所有唯一级别。- 这行代码将
group.cellType向量的每个元素与cellchat对象中的细胞聚类标签的级别进行关联,即给每个分组赋予了对应的细胞聚类名称。 netVisual_chord_cell是CellChat包中的一个函数,用于绘制细胞间通讯的弦图。cellchat:是CellChat对象,包含了细胞间通讯分析的所有结果。signaling = pathways.show:指定要可视化的信号通路,这里pathways.show之前定义为"CXCL",所以只展示CXCL信号通路的细胞间通讯。group = group.cellType:指定细胞的分组信息,即前面定义的将细胞聚类分组为"FIB"、"DC"和"TC"的向量。弦图将根据这个分组来展示不同组之间的细胞通讯关系。title.name = paste0(pathways.show, " signaling network"):设置弦图的标题,paste0函数将pathways.show的值(即"CXCL")与" signaling network"连接起来,形成标题"CXCL signaling network"。
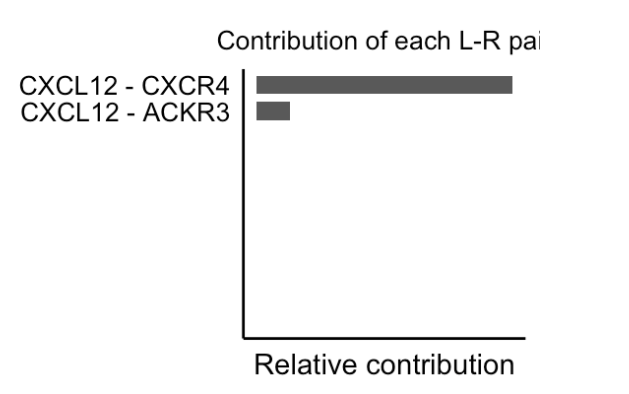
3、计算每个配体-受体对 对整个信号通路的贡献,并且可视化由配体-受体对介导的细胞通讯
netAnalysis_contribution(cellchat, signaling = pathways.show)netAnalysis_contribution是CellChat包中的函数,其作用是计算指定信号通路里每个配体 - 受体对(L - R 对)对整体信号通路的贡献。cellchat是包含细胞间通讯分析结果的CellChat对象。signaling = pathways.show明确要分析的信号通路,这里pathways.show之前定义为"CXCL"。
1 提取显著的配体 - 受体对并可视化
pairLR.CXCL <- extractEnrichedLR(cellchat, signaling = pathways.show, geneLR.return = FALSE)
LR.show <- pairLR.CXCL[1,] # show one ligand-receptor pairextractEnrichedLR函数用于从指定信号通路中提取所有显著的配体 - 受体对及其相关信号基因。geneLR.return = FALSE表示不返回相关信号基因。LR.show <- pairLR.CXCL[1,]选取提取出的配体 - 受体对中的第一对用于后续可视化。
层次图可视化
# Hierarchy plot
vertex.receiver = seq(1,4) # a numeric vector
netVisual_individual(cellchat, signaling = pathways.show, pairLR.use = LR.show, vertex.receiver = vertex.receiver)vertex.receiver是一个数值向量,用于指定接收信号的细胞顶点索引,以此控制层次图的布局。netVisual_individual函数用于可视化单个配体 - 受体对介导的细胞间通讯。pairLR.use = LR.show表示使用前面选取的第一对配体 - 受体对进行可视化。
圆形图可视化
#> [[1]]
# Circle plot
netVisual_individual(cellchat, signaling = pathways.show, pairLR.use = LR.show, layout = "circle")
同样使用 netVisual_individual 函数,不过将布局设置为 "circle",以圆形图的形式展示单个配体 - 受体对介导的细胞间通讯。
和弦图可视化
#> [[1]]
# Chord diagram
netVisual_individual(cellchat, signaling = pathways.show, pairLR.use = LR.show, layout = "chord")
再次使用 netVisual_individual 函数,将布局设置为 "chord",以弦图的形式展示单个配体 - 受体对介导的细胞间通讯。
3 自动保存所有推断网络的可视化结果
# Access all the signaling pathways showing significant communications
pathways.show.all <- cellchat@netP$pathways
# check the order of cell identity to set suitable vertex.receiver
levels(cellchat@idents)
vertex.receiver = seq(1,4)
for (i in 1:length(pathways.show.all)) {
  # Visualize communication network associated with both signaling pathway and individual L-R pairs
  netVisual(cellchat, signaling = pathways.show.all[i], vertex.receiver = vertex.receiver, layout = "hierarchy")
  # Compute and visualize the contribution of each ligand-receptor pair to the overall signaling pathway
  gg <- netAnalysis_contribution(cellchat, signaling = pathways.show.all[i])
  ggsave(filename=paste0(pathways.show.all[i], "_L-R_contribution.pdf"), plot=gg, width = 3, height = 2, units = 'in', dpi = 300)
}
pathways.show.all <- cellchat@netP$pathways获取所有显示出显著通讯的信号通路。levels(cellchat@idents)查看细胞身份的顺序,以便设置合适的vertex.receiver。- 通过
for循环遍历所有显著的信号通路:netVisual函数以层次图的形式可视化每个信号通路的细胞间通讯网络。netAnalysis_contribution函数计算每个信号通路中每个配体 - 受体对的贡献,并将结果存储在gg中。ggsave函数将每个信号通路的配体 - 受体对贡献图保存为 PDF 文件,文件名包含信号通路名称。
二、可视化由多种配体受体或信号通路介导的细胞间通讯
这里主要有两种方式:气泡图、和弦图
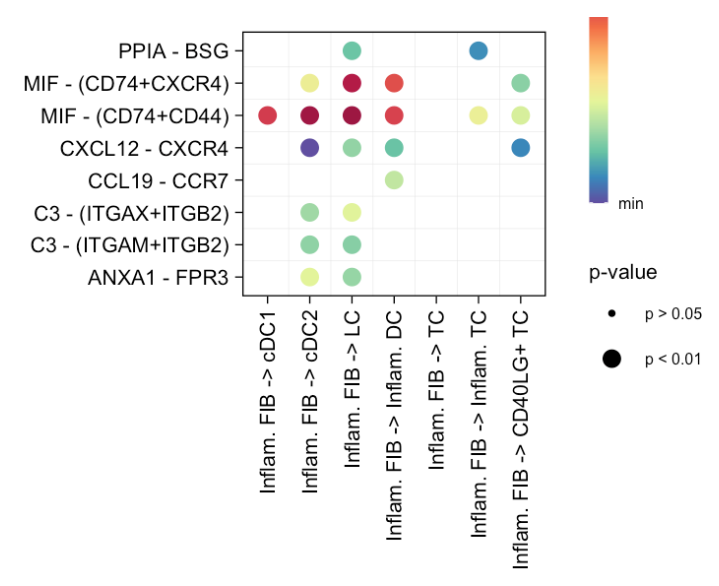
1 用气泡图来可视化:从特定源细胞组(sources.use 定义)到特定目标细胞组(targets.use 定义)
# (1) show all the significant interactions (L-R pairs) from some cell groups (defined by 'sources.use') to other cell groups (defined by 'targets.use')
netVisual_bubble(cellchat, sources.use = 4, targets.use = c(5:11), remove.isolate = FALSE)
#> Comparing communications on a single object-
netVisual_bubble函数:这是CellChat包中专门用于生成气泡图来可视化细胞间通讯的函数。气泡图可以直观地展示不同细胞群体之间通过配体 - 受体对进行通讯的强度和显著性。 -
sources.use = 4:指定源细胞组。这里的数字4表示选择第 4 个细胞群体作为信号发送的源细胞组。在CellChat分析中,细胞群体通常会被编号,这个编号对应着特定的细胞类型或者细胞聚类。 -
targets.use = c(5:11):指定目标细胞组。c(5:11)表示选择从第 5 个到第 11 个细胞群体作为信号接收的目标细胞组。这意味着代码将展示从第 4 个细胞群体到第 5 至 11 个细胞群体之间的细胞间通讯。 -
remove.isolate = FALSE:这个参数控制是否移除那些没有显著通讯的孤立细胞或细胞组。设置为FALSE表示不移除这些孤立的元素,会在气泡图中保留所有的细胞组,即使它们之间没有显著的通讯信号。
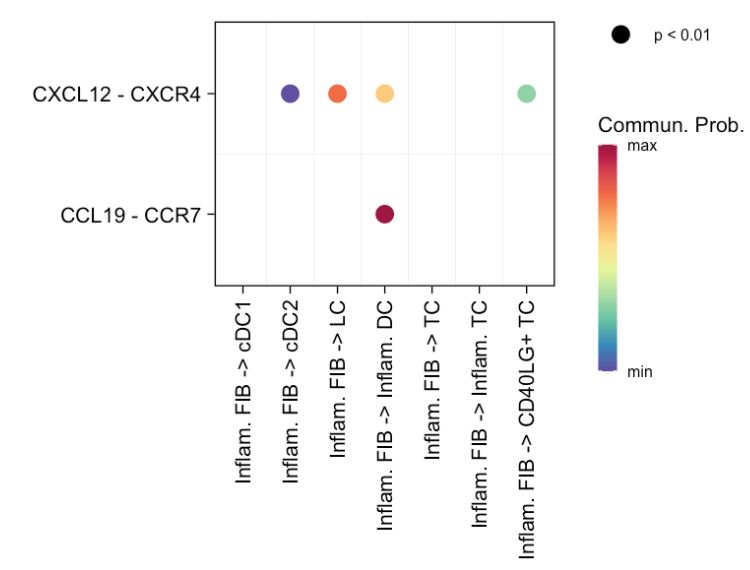
2 增加了对特定信号通路的筛选
# (2) show all the significant interactions (L-R pairs) associated with certain signaling pathways
netVisual_bubble(cellchat, sources.use = 4, targets.use = c(5:11), signaling = c("CCL","CXCL"), remove.isolate = FALSE)
#> Comparing communications on a single object
signaling = c("CCL","CXCL"):这是新增的参数,指定要展示的信号通路。这里选择了"CCL"和"CXCL"这两条信号通路,意味着只会展示与这两条信号通路相关的配体 - 受体对介导的细胞间通讯。
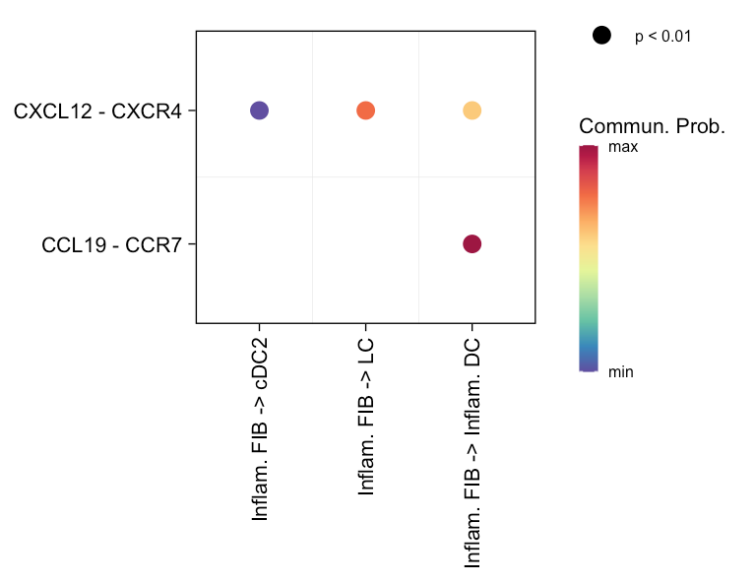
3 依据用户输入的特定配体 - 受体对(L - R 对)来可视化——特定的源细胞组和特定的目标细胞组之间显著的细胞间通讯
# (3) show all the significant interactions (L-R pairs) based on user's input (defined by `pairLR.use`)
pairLR.use <- extractEnrichedLR(cellchat, signaling = c("CCL","CXCL","FGF"))
netVisual_bubble(cellchat, sources.use = c(3,4), targets.use = c(5:8), pairLR.use = pairLR.use, remove.isolate = TRUE)
#> Comparing communications on a single object
sources.use = c(3,4):指定源细胞组,这里选择第 3 和第 4 个细胞群体作为信号发送的源细胞组。targets.use = c(5:8):指定目标细胞组,选择从第 5 个到第 8 个细胞群体作为信号接收的目标细胞组。pairLR.use = pairLR.use:使用之前提取的与"CCL"、"CXCL"和"FGF"信号通路相关的配体 - 受体对,只展示这些配体 - 受体对介导的细胞间通讯。remove.isolate = TRUE:该参数控制是否移除那些没有显著通讯的孤立细胞或细胞组。设置为TRUE表示移除这些孤立元素,只在气泡图中保留有显著通讯的细胞组。
4 可视化参数调整
主要是使用 netVisual_bubble 函数绘制气泡图,并且可以按照不同规则对参与通讯的细胞对在 x 轴上进行排序,以满足不同的可视化需求。
(4) 默认排序方式
# (4) Default: first sort cell pairs based on the appearance of sources in levels(object@idents), and then based on the appearance of targets in levels(object@idents)这部分没有给出具体代码调用,但说明了默认排序规则:先根据源细在 levels(object@idents) 中的出现顺序对细胞对进行排序,然后再依据目标细胞在 levels(object@idents) 中的出现顺序进一步排序。
(5) 基于用户定义的目标细胞组排序
netVisual_bubble(cellchat, targets.use = c("LC","Inflam. DC","cDC2","CD40LG+ TC"), pairLR.use = pairLR.use, remove.isolate = TRUE, sort.by.target = T)targets.use = c("LC","Inflam. DC","cDC2","CD40LG+ TC"):指定目标细胞组为"LC"、"Inflam. DC"、"cDC2"和"CD40LG+ TC"。pairLR.use = pairLR.use:使用之前提取的特定配体 - 受体对。remove.isolate = TRUE:移除没有显著通讯的孤立细胞或细胞组。sort.by.target = T:设置为TRUE表示按照用户指定的目标细胞组顺序对细胞对进行排序。
(6) 基于用户定义的源细胞组排序
netVisual_bubble(cellchat, sources.use = c("FBN1+ FIB","APOE+ FIB","Inflam. FIB"), pairLR.use = pairLR.use, remove.isolate = TRUE, sort.by.source = T)sources.use = c("FBN1+ FIB","APOE+ FIB","Inflam. FIB"):指定源细胞组为"FBN1+ FIB"、"APOE+ FIB"和"Inflam. FIB"。sort.by.source = T:设置为TRUE表示按照用户指定的源细胞组顺序对细胞对进行排序。
(7) 先基于用户定义的源细胞组,再基于目标细胞组排序
netVisual_bubble(cellchat, sources.use = c("FBN1+ FIB","APOE+ FIB","Inflam. FIB"), targets.use = c("LC","Inflam. DC","cDC2","CD40LG+ TC"), pairLR.use = pairLR.use, remove.isolate = TRUE, sort.by.source = T, sort.by.target = T)- 同时指定了源细胞组
sources.use和目标细胞组targets.use。 sort.by.source = T和sort.by.target = T:先按照用户指定的源细胞组顺序对细胞对进行排序,然后再按照目标细胞组顺序进一步排序。
(8) 先基于用户定义的目标细胞组,再基于源细胞组排序
netVisual_bubble(cellchat, sources.use = c("FBN1+ FIB","APOE+ FIB","Inflam. FIB"), targets.use = c("LC","Inflam. DC","cDC2","CD40LG+ TC"), pairLR.use = pairLR.use, remove.isolate = TRUE, sort.by.source = T, sort.by.target = T, sort.by.source.priority = FALSE)sort.by.source.priority = FALSE:当sort.by.source和sort.by.target都为TRUE时,该参数设置为FALSE表示先按照目标细胞组顺序排序,再按照源细胞组顺序排序。
2 用和弦图来可视化:
可以使用该函数展示从某些细胞群体到其他细胞群体的所有显著的配体 - 受体对或信号通路介导的相互作用:
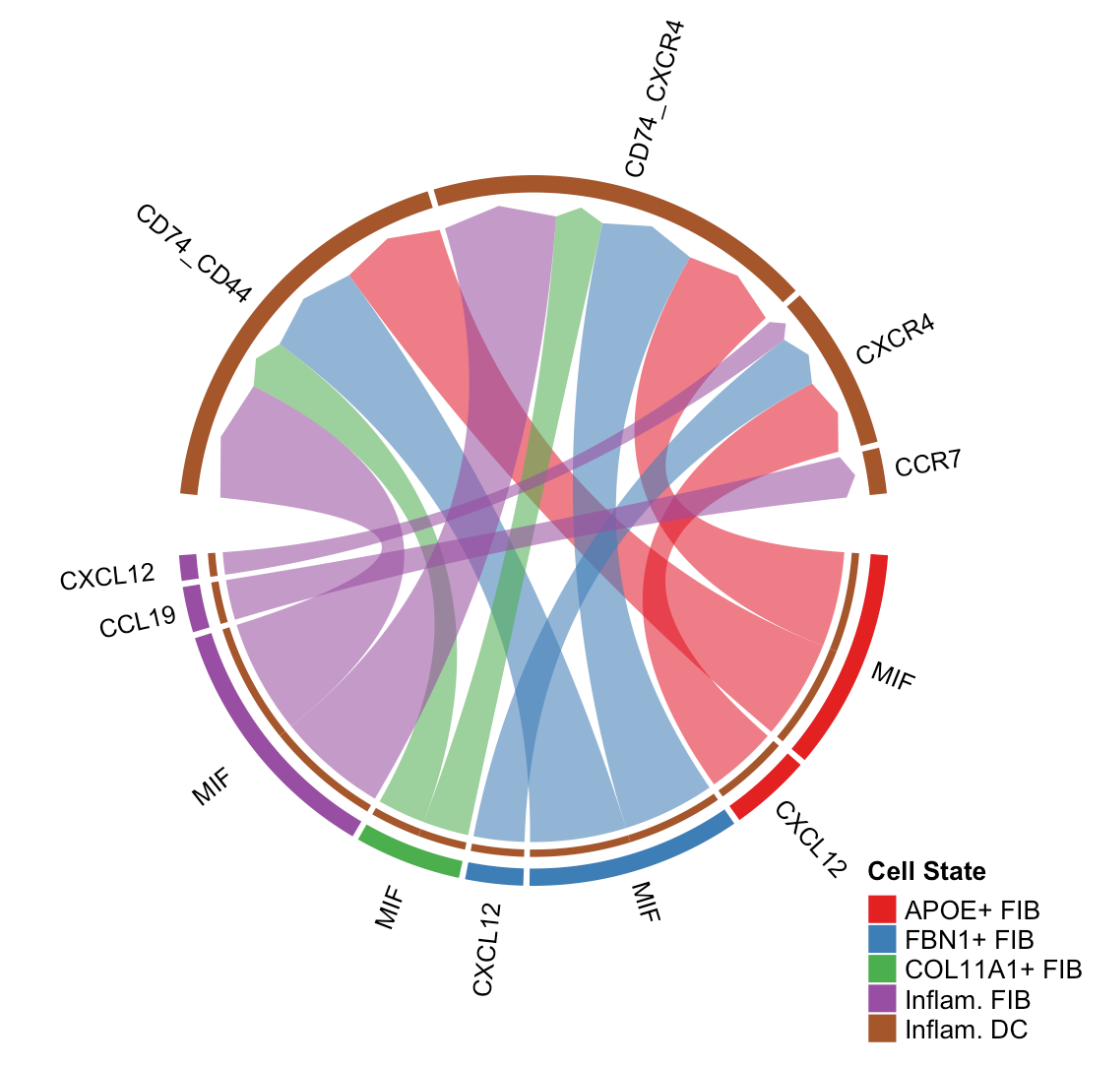
# 假设 cellchat 是 CellChat 对象,sources.use 和 targets.use 分别指定源细胞和目标细胞群体 netVisual_chord_gene(cellchat, sources.use = c(1, 2), targets.use = c(3, 4))
可以指定一个特定的细胞群体作为源细胞,展示该细胞群体向其他所有细胞群体发送的所有相互作用:
# 假设 cellchat 是 CellChat 对象,source.use 指定单个源细胞群体 netVisual_chord_gene(cellchat, source.use = 1)
可以指定一个特定的细胞群体作为目标细胞,展示其他所有细胞群体向该细胞群体发送的所有相互作用:
# 假设 cellchat 是 CellChat 对象,target.use 指定单个目标细胞群体 netVisual_chord_gene(cellchat, target.use = 3)
可以根据用户的需求,指定特定的配体 - 受体对或信号通路进行可视化。例如,用户可以提取特定信号通路的配体 - 受体对,然后使用这些对来绘制弦图:
# 假设 pairLR.use 是用户提取的特定配体 - 受体对 pairLR.use <- extractEnrichedLR(cellchat, signaling = c("CCL", "CXCL")) netVisual_chord_gene(cellchat, pairLR.use = pairLR.use)
# show all the significant interactions (L-R pairs) from some cell groups (defined by 'sources.use') to other cell groups (defined by 'targets.use')
# show all the interactions sending from Inflam.FIB
netVisual_chord_gene(cellchat, sources.use = 4, targets.use = c(5:11), lab.cex = 0.5,legend.pos.y = 30)
(1)展示从特定源细胞组到目标细胞组的显著配体 - 受体对相互作用
# show all the significant interactions (L-R pairs) from some cell groups (defined by 'sources.use') to other cell groups (defined by 'targets.use')
# show all the interactions sending from Inflam.FIB
netVisual_chord_gene(cellchat, sources.use = 4, targets.use = c(5:11), lab.cex = 0.5,legend.pos.y = 30)
sources.use = 4:指定源细胞组为第 4 个细胞群体,这里推测第 4 个细胞群体是Inflam.FIB(炎症性成纤维细胞)。targets.use = c(5:11):指定目标细胞组为从第 5 个到第 11 个细胞群体。lab.cex = 0.5:设置弦图中标签的大小比例为 0.5,可使标签显示得更小。legend.pos.y = 30:设置图例在 y 轴方向上的位置为 30。
(2)展示特定目标接受的所有相互作用
# show all the interactions received by Inflam.DC
netVisual_chord_gene(cellchat, sources.use = c(1,2,3,4), targets.use = 8, legend.pos.x = 15)
sources.use = c(1,2,3,4):指定源细胞组为第 1 到第 4 个细胞群体。targets.use = 8:指定目标细胞组为第 8 个细胞群体,这里推测第 8 个细胞群体是Inflam.DC(炎症性树突状细胞)。legend.pos.x = 15:设置图例在 x 轴方向上的位置为 15。
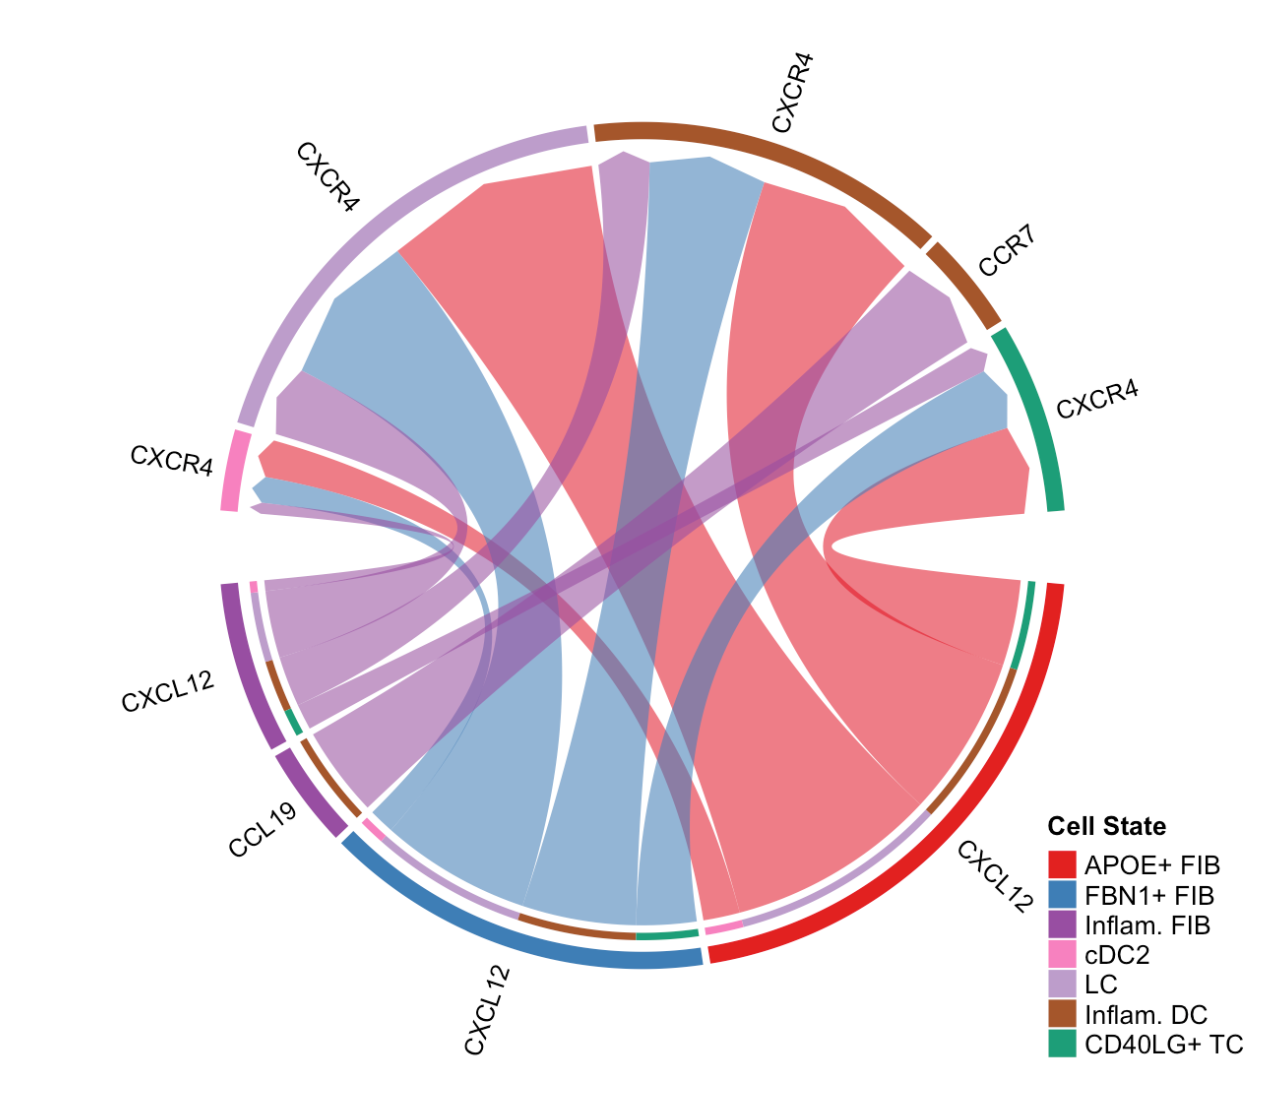
(3)展示与特定信号通路相关的显著配体 - 受体对相互作用
# show all the significant interactions (L-R pairs) associated with certain signaling pathways
netVisual_chord_gene(cellchat, sources.use = c(1,2,3,4), targets.use = c(5:11), signaling = c("CCL","CXCL"),legend.pos.x = 8)
signaling = c("CCL","CXCL"):指定要展示的信号通路为"CCL"和"CXCL",即只展示与这两条信号通路相关的配体 - 受体对介导的细胞间相互作用。legend.pos.x = 8:设置图例在 x 轴方向上的位置为 8。
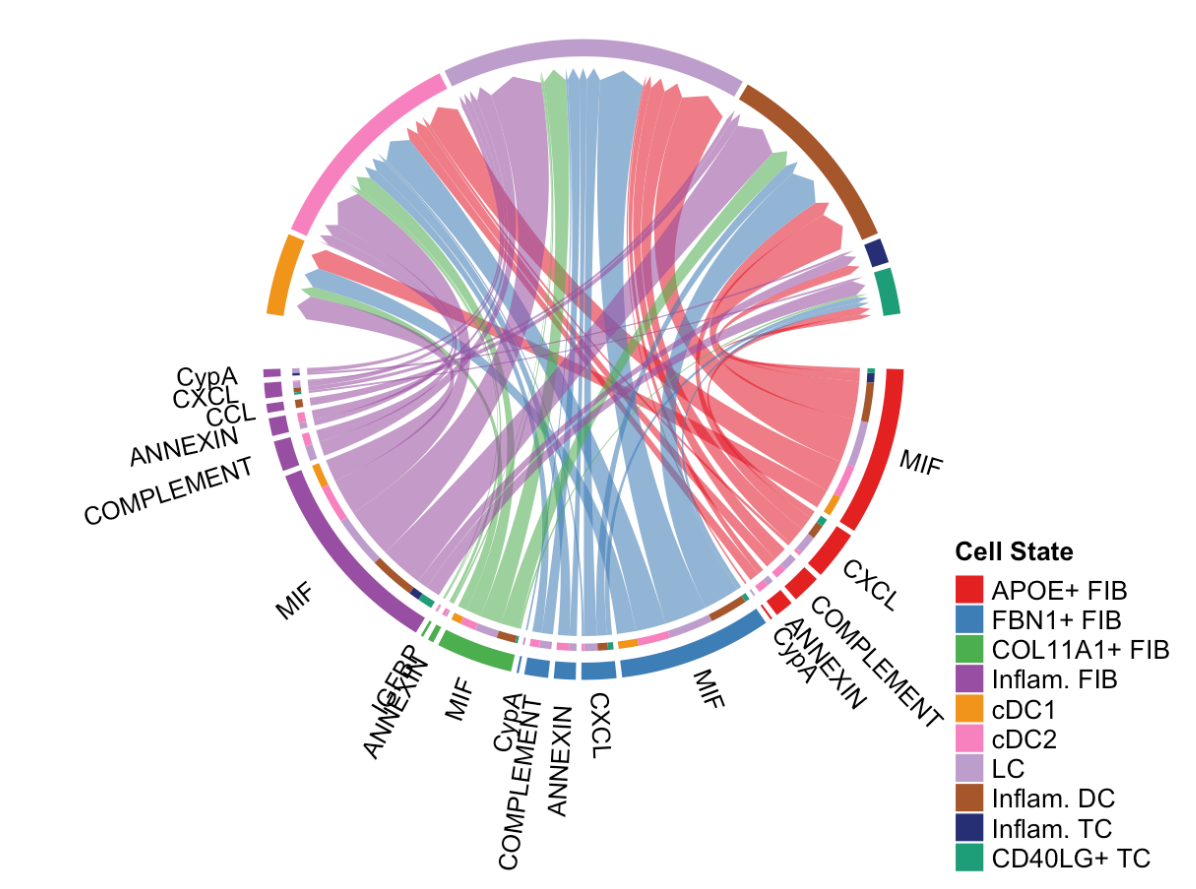
(4)展示从特定源细胞组到目标细胞组的显著信号通路
# show all the significant signaling pathways from some cell groups (defined by 'sources.use') to other cell groups (defined by 'targets.use')
netVisual_chord_gene(cellchat, sources.use = c(1,2,3,4), targets.use = c(5:11), slot.name = "netP", legend.pos.x = 10)
slot.name = "netP":指定从CellChat对象的netP槽中获取数据,用于展示信号通路层面的细胞间通讯。legend.pos.x = 10:设置图例在 x 轴方向上的位置为 10。
注意事项
- 在绘制弦图时,如果出现类似 “Note: The first link end is drawn out of sector ‘MIF’.” 这样的提示信息,可以忽略。
- 如果弦图中基因名称出现重叠的情况,可以通过减小
small.gap参数的值来调整基因名称的显示。
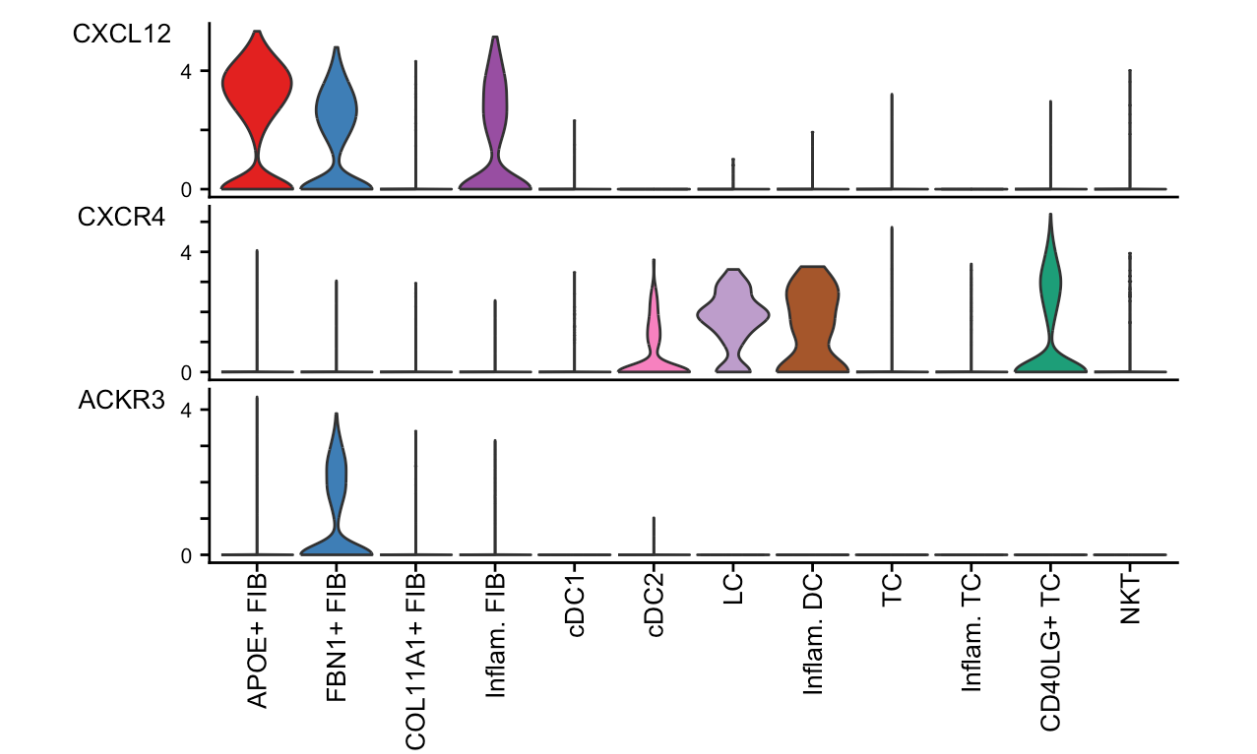
三、使用 plotGeneExpression 函数对信号基因的表达分布进行可视化
并且可以选择不同的可视化类型(如小提琴图、点图、条形图)。同时还记录了代码的执行时间。
plotGeneExpression(cellchat, signaling = "CXCL", enriched.only = TRUE, type = "violin")plotGeneExpression函数:这是CellChat包中的一个封装函数,依赖于Seurat包。它用于绘制与配体 - 受体对(L - R pairs)或信号通路相关的信号基因的表达分布。cellchat:是CellChat对象,包含了细胞间通讯分析的结果。signaling = "CXCL":指定要分析的信号通路为"CXCL"。enriched.only = TRUE:表示只展示与推断出的显著通讯相关的信号基因的表达。type = "violin":指定可视化的类型为小提琴图(violin plot),小提琴图可以展示数据的分布、中位数和四分位数等信息。
plotGeneExpression(cellchat, signaling = "CXCL", enriched.only = TRUE, type = "violin")
#> The legacy packages maptools, rgdal, and rgeos, underpinning the sp package,
#> which was just loaded, were retired in October 2023.
#> Please refer to R-spatial evolution reports for details, especially
#> https://r-spatial.org/r/2023/05/15/evolution4.html.
#> It may be desirable to make the sf package available;
#> package maintainers should consider adding sf to Suggests:.
#> Scale for y is already present.
#> Adding another scale for y, which will replace the existing scale.
#> Scale for y is already present.
#> Adding another scale for y, which will replace the existing scale.
#> Scale for y is already present.
#> Adding another scale for y, which will replace the existing scale.
下面的#>的内容:
这些是代码运行过程中产生的警告信息。前一部分提示 maptools、rgdal 和 rgeos 这些支撑 sp 包的旧版包在 2023 年 10 月已停用,建议参考相关报告并考虑使用 sf 包。后一部分提示在添加 y 轴刻度时,已存在的刻度将被替换。
print(as.numeric(execution.time, units = "secs"))
#> [1] 38.73308
as.numeric(execution.time, units = "secs")将execution.time转换为以秒为单位的数值。print函数将这个数值打印出来,这里显示代码执行时间为 38.73308 秒。
plotGeneExpression(cellchat, signaling = "CXCL", enriched.only = FALSE)
execution.time = Sys.time() - ptm- 同样使用
plotGeneExpression函数,但将enriched.only参数设置为FALSE,表示展示与"CXCL"信号通路相关的所有信号基因的表达,而不仅仅是与显著通讯相关的基因。


 1742
1742

 被折叠的 条评论
为什么被折叠?
被折叠的 条评论
为什么被折叠?
 到【灌水乐园】发言


