


 本文介绍了如何在R中使用ggplot2包添加均值曲线和拟合曲线。首先,通过aggregate函数计算数据的均值,然后利用ggplot2绘制图形,并探讨了添加不同类型的拟合曲线,如‘auto’、‘lm’、‘glm’、‘gam’、‘loess’,以及调整平滑度参数span来控制曲线的平滑程度。
R 添加均值曲线
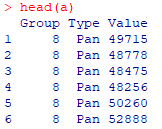
数据情况
计算均值
a.mean=aggregate(Value ~ Group, data = a, FUN = “mean”)
绘图
library(ggplot2)
library(ggpubr)
a=read.table("C:\\Users\\XXX\\Desktop\\result.finnal.xls.plot",head=T)
a.mean=aggregate(Value ~ Group, data = a, FUN = "mean")
p<-ggplot(a, aes(x=Group, y=Value)) +geom_point(size=2,shape=21,color="gray40")+theme_classic()+ scale_x_continuous(limits=c(2,16),breaks=seq(2,16,1)) +xlab("Number of genomes")+ylab("Number of gene families")
layer2<-geom_xspline(aes(x=Group, y=Value), a.mean, color="gray30",size=1.5,linetype="dashed",position = "identity",inherit.aes = FALSE)
p+ t
最低0.47元/天 解锁文章


 4085
4085

 被折叠的 条评论
为什么被折叠?
被折叠的 条评论
为什么被折叠?
 到【灌水乐园】发言


