


✅作者简介:热爱科研的Matlab仿真开发者,擅长数据处理、建模仿真、程序设计、完整代码获取、论文复现及科研仿真。
🍎 往期回顾关注个人主页:Matlab科研工作室
🍊个人信条:格物致知,完整Matlab代码获取及仿真咨询内容私信。
🔥 内容介绍
在机器人导航、物流配送、户外作业等场景中,GPS 路径可视化是 “直观展示轨迹、分析运动状态” 的核心工具:
- 机器人导航:将 A 星 / 自适应 RRT 规划的路径,叠加到真实地理环境(谷歌地图),验证路径与实际障碍物的匹配度;
- 物流配送:实时跟踪货车 / 无人机轨迹,监控配送进度与偏离情况;
- 运动分析:展示跑步 / 骑行轨迹,叠加速度、海拔等数据,生成可视化报告;
- 设备监控:跟踪工程设备(如起重机、巡检机器人)的移动轨迹,确保作业范围合规。
谷歌地图 API 提供了强大的地理可视化能力,支持自定义轨迹样式、实时更新、交互查询,是实现 GPS 路径跟踪的首选工具。本文将分 “离线轨迹渲染”“实时 GPS 跟踪”“进阶优化” 三部分,教你快速落地。
⛳️ 运行结果
📣 部分代码
% PLOTROADMAPSPEED Plots a roadmap with speed data.
%
% [totalDistKiloMeters, totalDistMiles] = plotRoadmapSpeed(gpsdat, latlong, apiKey, pathtype, linespecifiers, speedplotpath)
%
% This function takes GPS data and plots a roadmap with speed information.
%
% Inputs:
% gpsdat - GPS data containing latitude, longitude, and speed information.
% latlong - Latitude and longitude data for the roadmap.
% apiKey - API key for accessing map services.
% pathtype - How to join GPS latitude and longitude data [discrete | continuous].
% linespecifiers - Line specifiers for customizing the plot appearance.
% speedplotpath - Path where the speed plot will be saved.
%
% Outputs:
% totalDistKiloMeters - Total distance covered in kilometers.
% totalDistMiles - Total distance covered in miles.
% plot route data using Google map
% Please note that Google Maps API Key is mandatory!
% Find the distance of the experiment. Compute distances (in degrees)
% between consecutive lat/long pairs.
d_deg = distance(gpsdat(1:end-1,1), gpsdat(1:end-1,2), ...
gpsdat(2:end,1), gpsdat(2:end,2));
% Convert distances from degrees to kilometers.
vehiDistArray = distdim(d_deg, 'deg', 'kilometers');
totalDistKiloMeters = sum(vehiDistArray); % In kilometers
totalDistMiles = totalDistKiloMeters / 1.6; % Convert to miles
%--------------------------------------------------------------------------
% Plot pavement distress classification and route data by Google map
switch pathtype
case 'continuous'
latlold = [ latlong(1,1), latlong(1, 2) ];
figure;
set(gcf, 'Position', [50, 50, 850, 700])
hold on
for i = 2:length(gpsdat)
if ((gpsdat(i,5) >= 0) && (gpsdat(i,5) <= 30))
latlnew = [latlong(i,1), latlong(i, 2)];
long = [latlold(1); latlnew(1)];
lat = [latlold(2); latlnew(2)];
if (linespecifiers == 1)
h(1) = plot(long, lat , '-o', 'color', ...
[233 17 212]/255, 'LineWidth', 1);
elseif (linespecifiers == 0)
h(1) = plot(long, lat , 'color', ...
[233 17 212]/255, 'LineWidth', 2);
end
elseif ((gpsdat(i,5) > 30) && (gpsdat(i,5) <= 40))
latlnew = [latlong(i,1), latlong(i, 2)];
long = [latlold(1); latlnew(1)];
lat = [latlold(2); latlnew(2)];
if (linespecifiers == 1)
h(2) = plot(long, lat , '-x', 'color', ...
[0 153 0]/255, 'LineWidth', 1);
elseif (linespecifiers == 0)
h(2) = plot(long, lat , 'color', ...
[0 153 0]/255, 'LineWidth', 2);
end
elseif ((gpsdat(i,5) > 40) && (gpsdat(i,5) <= 50))
latlnew = [latlong(i,1), latlong(i, 2)];
long = [latlold(1); latlnew(1)];
lat = [latlold(2); latlnew(2)];
if (linespecifiers == 1)
h(3) = plot(long, lat , '-d', 'color', ...
[0 0 128]/255, 'LineWidth', 1);
elseif (linespecifiers == 0)
h(3) = plot(long, lat , 'color', ...
[0 0 128]/255, 'LineWidth', 2);
end
elseif ((gpsdat(i,5) > 50) && (gpsdat(i,5) <= 60))
latlnew = [latlong(i,1), latlong(i, 2)];
long = [latlold(1); latlnew(1)];
lat = [latlold(2); latlnew(2)];
if (linespecifiers == 1)
h(4) = plot(long, lat , '-v', 'color', ...
[0 255 255]/255, 'LineWidth', 1);
elseif (linespecifiers == 0)
h(4) = plot(long, lat , 'color', ...
[0 255 255]/255, 'LineWidth', 2);
end
else
latlnew = [latlong(i,1), latlong(i, 2)];
long = [latlold(1); latlnew(1)];
lat = [latlold(2); latlnew(2)];
if (linespecifiers == 1)
h(5) = plot(long, lat , '-^', 'color', ...
[255 51 51]/255, 'LineWidth', 1);
elseif (linespecifiers == 0)
h(5) = plot(long, lat , 'color', ...
[255 51 51]/255, 'LineWidth', 2);
end
end
latlold = latlnew;
end
hold off
case 'discrete'
figure;
set(gcf, 'Position', [150, 150, 850, 700])
hold on
for i = 1:length(gpsdat)
if ((gpsdat(i,5) >= 0) && (gpsdat(i,5) <= 30))
h(1) = plot(latlong(i,1), latlong(i,2) , 'color', [233 17 212]/255, 'Marker', 'o', 'MarkerSize', 5);
elseif ((gpsdat(i,5) > 30) && (gpsdat(i,5) <= 40))
h(2) = plot(latlong(i,1), latlong(i,2), 'color', [0 153 0]/255, 'Marker', 'x', 'MarkerSize', 5);
elseif ((gpsdat(i,5) > 40) && (gpsdat(i,5) <= 50))
h(3) = plot(latlong(i,1), latlong(i,2), 'color', [0 0 128]/255, 'Marker', 'd', 'MarkerSize', 5);
elseif ((gpsdat(i,5) > 50) && (gpsdat(i,5) <= 60))
h(4) = plot(latlong(i,1), latlong(i,2), 'color', [0 255 255]/255, 'Marker', 'v', 'MarkerSize', 5);
else
h(5) = plot(latlong(i,1), latlong(i,2), 'color', [255 51 51]/255, 'Marker', '^', 'MarkerSize', 5);
end
end
hold off
end
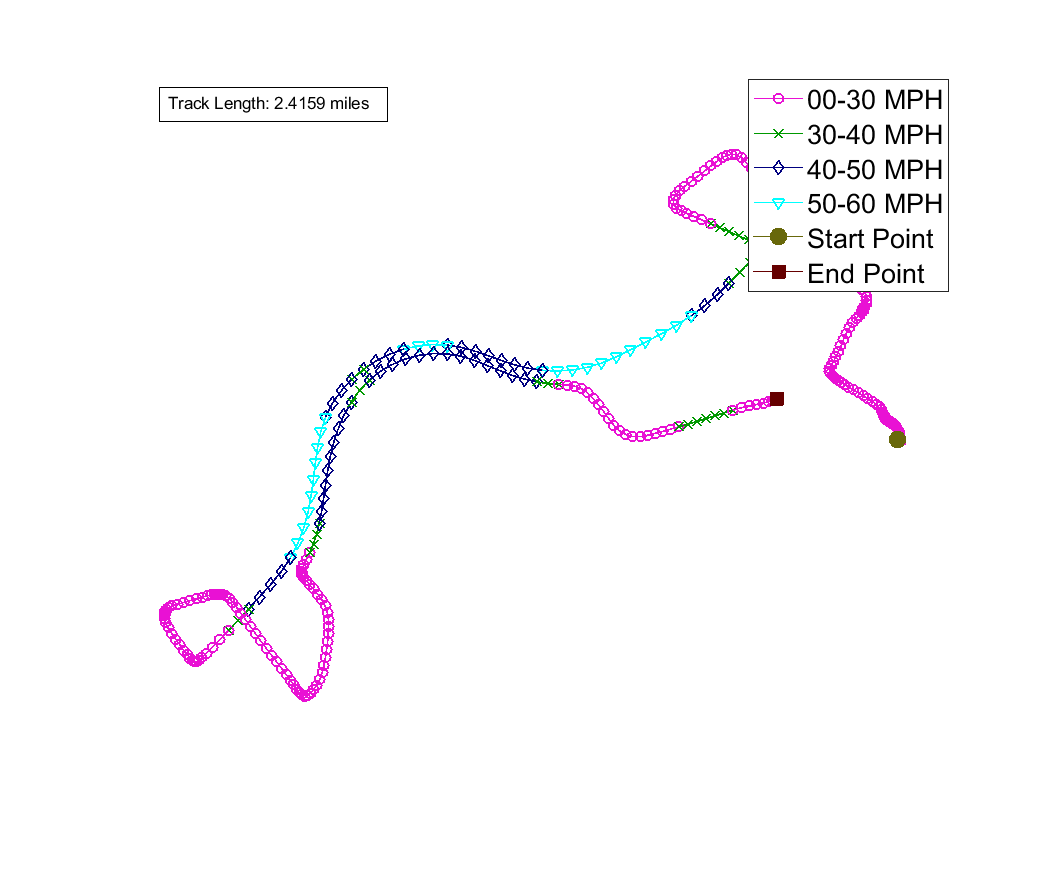
plot_google_map('maptype', 'roadmap', 'APIKey', apiKey);
annotation('textbox', [.15 0.8 0.1 0.1], 'BackgroundColor', [1 1 1], ...
'String', ['Track Length: ' num2str(totalDistMiles)...
' miles']);
starting = line(latlong(1, 1), latlong(1, 2), 'Marker', 'o', ...
'Color', [104 104 11]/255, 'MarkerFaceColor', [104 104 11]/255, 'MarkerSize', 10);
ending = line(latlong(end, 1), latlong(end, 2), 'Marker', 's', ...
'Color', [102 0 0]/255, 'MarkerFaceColor', [102 0 0]/255, 'MarkerSize', 10);
% Speed legend string
legend_string_cell{1} = '00-30 MPH';
legend_string_cell{2} = '30-40 MPH';
legend_string_cell{3} = '40-50 MPH';
legend_string_cell{4} = '50-60 MPH';
legend_string_cell{5} = ' > 60 MPH';
% Start/end point legend string
legend_string_cell{6} = 'Start Point';
legend_string_cell{7} = 'End Point';
% Legend
if isscalar(h)
legend([h starting ending], {legend_string_cell{1}, legend_string_cell{6}, legend_string_cell{7}})
elseif numel(h) == 2
legend([h starting ending], {legend_string_cell{1}, legend_string_cell{2}, legend_string_cell{6}, ...
legend_string_cell{7}})
elseif numel(h) == 3
legend([h starting ending], {legend_string_cell{1}, legend_string_cell{2}, legend_string_cell{3}, ...
legend_string_cell{6}, legend_string_cell{7}})
elseif numel(h) == 4
legend([h starting ending], {legend_string_cell{1}, legend_string_cell{2}, legend_string_cell{3}, ...
legend_string_cell{4}, legend_string_cell{6}, legend_string_cell{7}})
elseif numel(h) == 5
legend([h starting ending], {legend_string_cell{1}, legend_string_cell{2}, legend_string_cell{3}, ...
legend_string_cell{4}, legend_string_cell{5}, legend_string_cell{6}, ...
legend_string_cell{7}})
end
% Axis
axis off
% Export figure
exportgraphics(gcf, speedplotpath)
end
🔗 参考文献
🎈 部分理论引用网络文献,若有侵权联系博主删除
👇 关注我领取海量matlab电子书和数学建模资料
🏆团队擅长辅导定制多种科研领域MATLAB仿真,助力科研梦:
🌟 各类智能优化算法改进及应用
生产调度、经济调度、装配线调度、充电优化、车间调度、发车优化、水库调度、三维装箱、物流选址、货位优化、公交排班优化、充电桩布局优化、车间布局优化、集装箱船配载优化、水泵组合优化、解医疗资源分配优化、设施布局优化、可视域基站和无人机选址优化、背包问题、 风电场布局、时隙分配优化、 最佳分布式发电单元分配、多阶段管道维修、 工厂-中心-需求点三级选址问题、 应急生活物质配送中心选址、 基站选址、 道路灯柱布置、 枢纽节点部署、 输电线路台风监测装置、 集装箱调度、 机组优化、 投资优化组合、云服务器组合优化、 天线线性阵列分布优化、CVRP问题、VRPPD问题、多中心VRP问题、多层网络的VRP问题、多中心多车型的VRP问题、 动态VRP问题、双层车辆路径规划(2E-VRP)、充电车辆路径规划(EVRP)、油电混合车辆路径规划、混合流水车间问题、 订单拆分调度问题、 公交车的调度排班优化问题、航班摆渡车辆调度问题、选址路径规划问题、港口调度、港口岸桥调度、停机位分配、机场航班调度、泄漏源定位、冷链、时间窗、多车场等、选址优化、港口岸桥调度优化、交通阻抗、重分配、停机位分配、机场航班调度、通信上传下载分配优化
🌟 机器学习和深度学习时序、回归、分类、聚类和降维
2.1 bp时序、回归预测和分类
2.2 ENS声神经网络时序、回归预测和分类
2.3 SVM/CNN-SVM/LSSVM/RVM支持向量机系列时序、回归预测和分类
2.4 CNN|TCN|GCN卷积神经网络系列时序、回归预测和分类
2.5 ELM/KELM/RELM/DELM极限学习机系列时序、回归预测和分类
2.6 GRU/Bi-GRU/CNN-GRU/CNN-BiGRU门控神经网络时序、回归预测和分类
2.7 ELMAN递归神经网络时序、回归\预测和分类
2.8 LSTM/BiLSTM/CNN-LSTM/CNN-BiLSTM/长短记忆神经网络系列时序、回归预测和分类
2.9 RBF径向基神经网络时序、回归预测和分类
2.10 DBN深度置信网络时序、回归预测和分类
2.11 FNN模糊神经网络时序、回归预测
2.12 RF随机森林时序、回归预测和分类
2.13 BLS宽度学习时序、回归预测和分类
2.14 PNN脉冲神经网络分类
2.15 模糊小波神经网络预测和分类
2.16 时序、回归预测和分类
2.17 时序、回归预测预测和分类
2.18 XGBOOST集成学习时序、回归预测预测和分类
2.19 Transform各类组合时序、回归预测预测和分类
方向涵盖风电预测、光伏预测、电池寿命预测、辐射源识别、交通流预测、负荷预测、股价预测、PM2.5浓度预测、电池健康状态预测、用电量预测、水体光学参数反演、NLOS信号识别、地铁停车精准预测、变压器故障诊断
🌟图像处理方面
图像识别、图像分割、图像检测、图像隐藏、图像配准、图像拼接、图像融合、图像增强、图像压缩感知
🌟 路径规划方面
旅行商问题(TSP)、车辆路径问题(VRP、MVRP、CVRP、VRPTW等)、无人机三维路径规划、无人机协同、无人机编队、机器人路径规划、栅格地图路径规划、多式联运运输问题、 充电车辆路径规划(EVRP)、 双层车辆路径规划(2E-VRP)、 油电混合车辆路径规划、 船舶航迹规划、 全路径规划规划、 仓储巡逻、公交车时间调度、水库调度优化、多式联运优化
🌟 无人机应用方面
无人机路径规划、无人机控制、无人机编队、无人机协同、无人机任务分配、无人机安全通信轨迹在线优化、车辆协同无人机路径规划、
🌟 通信方面
传感器部署优化、通信协议优化、路由优化、目标定位优化、Dv-Hop定位优化、Leach协议优化、WSN覆盖优化、组播优化、RSSI定位优化、水声通信、通信上传下载分配
🌟 信号处理方面
信号识别、信号加密、信号去噪、信号增强、雷达信号处理、信号水印嵌入提取、肌电信号、脑电信号、信号配时优化、心电信号、DOA估计、编码译码、变分模态分解、管道泄漏、滤波器、数字信号处理+传输+分析+去噪、数字信号调制、误码率、信号估计、DTMF、信号检测
🌟电力系统方面
微电网优化、无功优化、配电网重构、储能配置、有序充电、MPPT优化、家庭用电、电/冷/热负荷预测、电力设备故障诊断、电池管理系统(BMS)SOC/SOH估算(粒子滤波/卡尔曼滤波)、 多目标优化在电力系统调度中的应用、光伏MPPT控制算法改进(扰动观察法/电导增量法)、电动汽车充放电优化、微电网日前日内优化、储能优化、家庭用电优化、供应链优化
🌟 元胞自动机方面
交通流 人群疏散 病毒扩散 晶体生长 金属腐蚀
🌟 雷达方面
卡尔曼滤波跟踪、航迹关联、航迹融合、SOC估计、阵列优化、NLOS识别
🌟 车间调度
零等待流水车间调度问题NWFSP 、 置换流水车间调度问题PFSP、 混合流水车间调度问题HFSP 、零空闲流水车间调度问题NIFSP、分布式置换流水车间调度问题 DPFSP、阻塞流水车间调度问题BFSP
👇


 641
641

 被折叠的 条评论
为什么被折叠?
被折叠的 条评论
为什么被折叠?
 到【灌水乐园】发言


