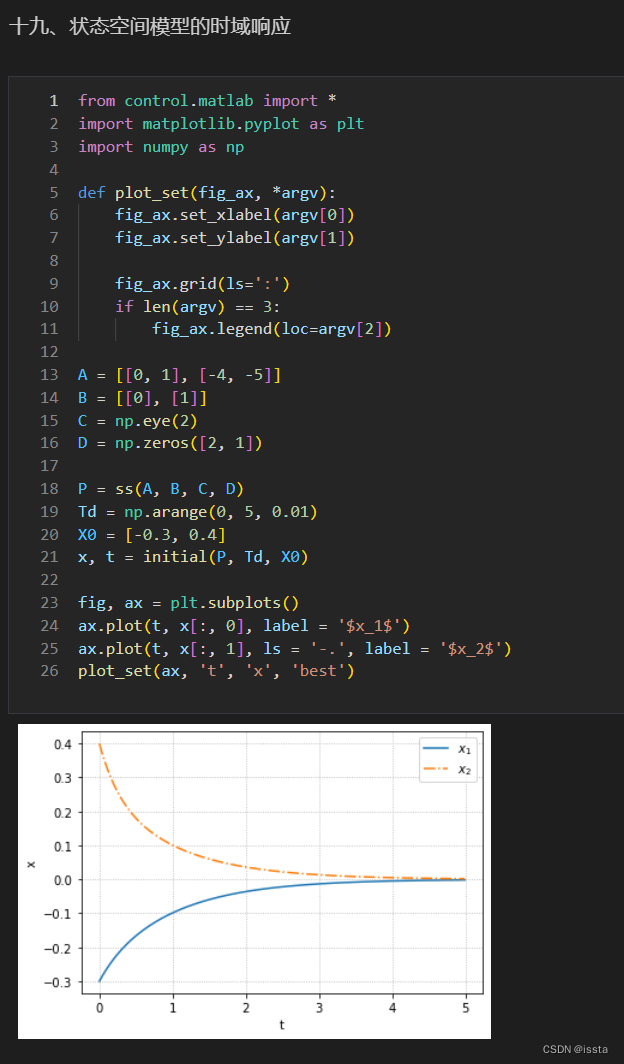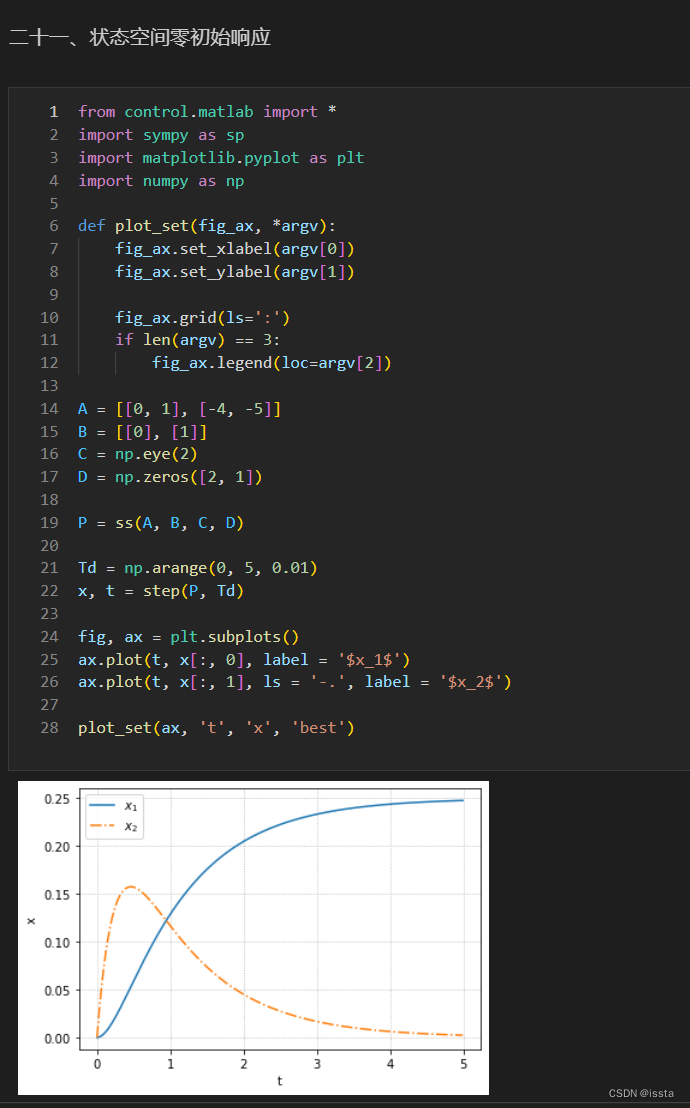


import control as ctrl
import sympy as sp
import matplotlib.pyplot as plt
import numpy as np


def linestyle_generator():
    linestyle = ['-', '--', '-.', ':']
    lineID = 0
    while True:
        yield linestyle[lineID]
        lineID = (lineID + 1) % len(linestyle)

def plot_set(fig_ax, *argv):
    fig_ax.set_xlabel(argv[0]) #--x轴标签
    fig_ax.set_ylabel(argv[1]) #--y轴标签

    fig_ax.grid(ls=':')
    if len(argv) == 3:
        fig_ax.legend(loc=argv[2]) #--图例位置

def bodeplot_set(fig_ax, *argv):
    #--设置幅频图的网络个和y轴标签
    fig_ax[0].grid(which='both', ls=':')
    fig_ax[0].set_ylabel('Gain [dB')

    #--设置相频图的网格和X轴,y轴标签
    fig_ax[1].grid(which='both', ls=':')
    fig_ax[1].set_xlabel('$\omega$ [rad/s]')
    fig_ax[1].set_ylabel('Phase [deg')

    if len(argv) > 0:
        fig_ax[1].legend(loc=argv[0])
    if len(argv) > 1:
        fig_ax[0].legend(loc=argv[1])

K = 1
T = [1, 0.5, 0.1]

LS = linestyle_generator()
fig, ax = plt.subplots(2, 1)

for i in range(len(T)):
    P = ctrl.tf([0, K], [T[i], 1])
    gain, phase, w = ctrl.bode(P, np.logspace(-2, 2), plot=False)
    plt_args = {'ls': next(LS), 'label':'T='+str(T[i])}
    ax[0].semilogx(w, 20*np.log10(gain), **plt_args)
    ax[1].semilogx(w, phase*180/np.pi, **plt_args)

bodeplot_set(ax, 3, 3)

![]()
import control as ctrl
import sympy as sp
import matplotlib.pyplot as plt
import numpy as np


def linestyle_generator():
    linestyle = ['-', '--', '-.', ':']
    lineID = 0
    while True:
        yield linestyle[lineID]
        lineID = (lineID + 1) % len(linestyle)

def plot_set(fig_ax, *argv):
    fig_ax.set_xlabel(argv[0]) #--x轴标签
    fig_ax.set_ylabel(argv[1]) #--y轴标签

    fig_ax.grid(ls=':')
    if len(argv) == 3:
        fig_ax.legend(loc=argv[2]) #--图例位置

def bodeplot_set(fig_ax, *argv):
    #--设置幅频图的网络个和y轴标签
    fig_ax[0].grid(which='both', ls=':')
    fig_ax[0].set_ylabel('Gain [dB')

    #--设置相频图的网格和X轴,y轴标签
    fig_ax[1].grid(which='both', ls=':')
    fig_ax[1].set_xlabel('$\omega$ [rad/s]')
    fig_ax[1].set_ylabel('Phase [deg')

    if len(argv) > 0:
        fig_ax[1].legend(loc=argv[0])
    if len(argv) > 1:
        fig_ax[0].legend(loc=argv[1])

zeta = [1, 0.7, 0.4]
omega_n = 1

LS = linestyle_generator()
fig, ax = plt.subplots(2, 1)

for i in range(len(zeta)):
    P = ctrl.tf([0, omega_n**2], [1, 2*zeta[i]*omega_n, omega_n**2])
    gain, phase, w = ctrl.bode(P, np.logspace(-2, 2), plot=False)

    plt_args = {'ls': next(LS)}
    plt_args['label'] = '$\zeta$=' + str(zeta[i])

    ax[0].semilogx(w, 20*np.log10(gain), **plt_args)
    ax[1].semilogx(w, phase*180/np.pi, **plt_args)

bodeplot_set(ax, 3, 3)

![]()
import control as ctrl
from control.matlab import *
import sympy as sp
import matplotlib.pyplot as plt
import numpy as np


def linestyle_generator():
    linestyle = ['-', '--', '-.', ':']
    lineID = 0
    while True:
        yield linestyle[lineID]
        lineID = (lineID + 1) % len(linestyle)

def plot_set(fig_ax, *argv):
    fig_ax.set_xlabel(argv[0])
    fig_ax.set_ylabel(argv[1])

    fig_ax.grid(ls=':')
    if len(argv) == 3:
        fig_ax.legend(loc=argv[2])

def bodeplot_set(fig_ax, *argv):
    fig_ax[0].grid(which='both', ls=':')
    fig_ax[0].set_ylabel('Gain [dB')

    fig_ax[1].grid(which='both', ls=':')
    fig_ax[1].set_xlabel('$\omega$ [rad/s]')
    fig_ax[1].set_ylabel('Phase [deg')

    if len(argv) > 0:
        fig_ax[1].legend(loc=argv[0])
    if len(argv) > 1:
        fig_ax[0].legend(loc=argv[1])

g = 9.81
L = 0.2
M = 0.5
mu = 1.5e-2
J = 1.0e-2

P = ctrl.tf([0, 1], [J, mu, M*g*L])
ref = 30
kp = (0.5, 1, 2)

LS = linestyle_generator()
fig, ax = plt.subplots()

for i in range(len(kp)):
    K = ctrl.tf([0, kp[i]], [0, 1])
    Gyr = ctrl.feedback(P*K, 1)

    y, t = step(Gyr, np.arange(0, 5, 0.01)) #--arangge(0, 2, 0.01)

    plt_args = {'ls': next(LS), 'label': '$k_P$=' + str(kp[i])}

    ax.plot(t, y*ref, **plt_args)

ax.axhline(ref, color="k", linewidth=0.5)
plot_set(ax, 't', 'y', 'best')


import control as ctrl
from control.matlab import *
import sympy as sp
import matplotlib.pyplot as plt
import numpy as np


def linestyle_generator():
    linestyle = ['-', '--', '-.', ':']
    lineID = 0
    while True:
        yield linestyle[lineID]
        lineID = (lineID + 1) % len(linestyle)

def plot_set(fig_ax, *argv):
    fig_ax.set_xlabel(argv[0])
    fig_ax.set_ylabel(argv[1])

    fig_ax.grid(ls=':')
    if len(argv) == 3:
        fig_ax.legend(loc=argv[2])

def bodeplot_set(fig_ax, *argv):
    fig_ax[0].grid(which='both', ls=':')
    fig_ax[0].set_ylabel('Gain [dB')

    fig_ax[1].grid(which='both', ls=':')
    fig_ax[1].set_xlabel('$\omega$ [rad/s]')
    fig_ax[1].set_ylabel('Phase [deg')

    if len(argv) > 0:
        fig_ax[1].legend(loc=argv[0])
    if len(argv) > 1:
        fig_ax[0].legend(loc=argv[1])

g = 9.81
L = 0.2
M = 0.5
mu = 1.5e-2
J = 1.0e-2

P = ctrl.tf([0, 1], [J, mu, M*g*L])
ref = 30
kp = 2
kd = (0, 0.1, 0.2)

LS = linestyle_generator()
fig, ax = plt.subplots()

for i in range(len(kd)):
    K = ctrl.tf([kd[i], kp], [0, 1])
    Gyr = ctrl.feedback(P*K, 1)

    y, t = step(Gyr, np.arange(0, 5, 0.01)) #--arangge(0, 2, 0.01)

    plt_args = {'ls': next(LS), 'label': '$k_D$=' + str(kd[i])}

    ax.plot(t, y*ref, **plt_args)

ax.axhline(ref, color="k", linewidth=0.5)
plot_set(ax, 't', 'y', 'best')

………………
代码丢失,不补啦……
………………


 本文通过Python的Control库展示了如何为不同参数的一阶和二阶系统绘制Bode图,并利用Matplotlib进行定制化的图表展示。此外,还介绍了如何为倒立摆系统的比例和比例微分控制器设置参数,以实现稳定的阶跃响应。


 5320
5320

 被折叠的 条评论
为什么被折叠?


