


 本文介绍如何使用Python的Scikit-learn库计算机器学习模型的AUC、Precision、Recall和F1分数,并通过绘制PR曲线确定最佳阈值。通过生成随机数据进行演示,展示了如何调整阈值以优化F1分数。
import numpy as np
from sklearn.metrics import precision_recall_fscore_support
from sklearn.metrics import roc_auc_score
from sklearn.metrics import precision_recall_curve
from numpy.random import random
import matplotlib.pyplot as plt
%matplotlib inline
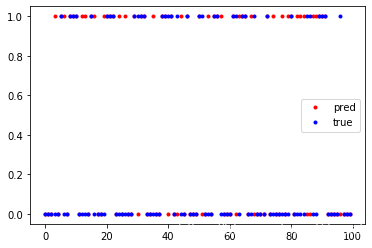
生成数据
N = 100
y_score = [random() for i in range(N)]
y_pred = [int(y_score[i]>0.5) for i in range(N)]
y_true = [int(y_score[i]>0.4) if random()>0.5 else 0 for i in range(N)]
plt.plot(y_pred,'.r',label='pred')
plt.plot(y_true,'.b',label='true')
plt.legend()
plt.show()
计算 AUC, Precision, Recall, F1
prec, rec, f1, _ = precision_recall_fscore_support(y_true, y_pred, average="binary")
auc = roc_auc_score(y_true, y_score)
print("AUC: %.4f Prec: %.4f Rec: %.4f F1: %.4f"%(auc, prec, rec, f1))

'''
AUC: 0.7640 Prec: 0.5417 Rec: 0.7429 F1: 0.6265
'''
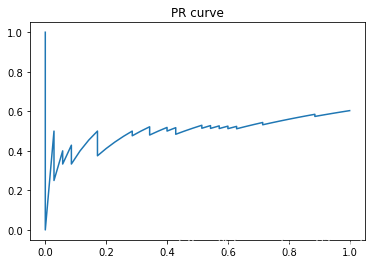
根据 F1 score 找出最佳阈值
def return_best_thr(y_true, y_score):
    precs, recs, thrs = precision_recall_curve(y_true, y_score)

    plt.plot(recs,precs)
    plt.title('PR curve')
    plt.show()

    f1s = 2 * precs * recs / (precs + recs)
    f1s = f1s[:-1]
    thrs = thrs[~np.isnan(f1s)]
    f1s = f1s[~np.isnan(f1s)]
    best_thr = thrs[np.argmax(f1s)]
    return best_thr

print('best threshold: ',return_best_thr(y_true, y_score))
'''
best threshold:  0.4036266180809812
'''


 1012
1012

 被折叠的 条评论
为什么被折叠?
被折叠的 条评论
为什么被折叠?
 到【灌水乐园】发言


