from pyecharts.charts import Line
from pyecharts.globals import CurrentConfig,NotebookType
CurrentConfig.NOTEBOOK_TYPE = NotebookType.JUPYTER_LAB
CurrentConfig.ONLINE_HOST = OnlineHostType.NOTEBOOK_HOST
c = (
Line(
init_opts=opts.InitOpts(
width='700px',
height='400px',
)
)
.add_xaxis(Faker.choose())
.add_yaxis('商家A',Faker.values())
.add_yaxis('商家B',Faker.values())
.set_global_opts(
title_opts=opts.TitleOpts(title='折线图'),
tooltip_opts=opts.TooltipOpts(trigger='axis')
)
.set_series_opts(
itemstyle_opts=opts.ItemStyleOpts(
color='blue',
opacity='0.5',
border_color='green',
border_width='2'
),
linestyle_opts=opts.LineStyleOpts(
is_show=True,
width=2,
color='green',
type_='dashed',
),
label_opts=opts.LabelOpts(
position='top',
color='red',
font_size=14,
font_family='Arial',
font_style='italic',
font_weight='bold',
rotate=-45,
),
markpoint_opts=opts.MarkPointOpts(
data=[
opts.MarkPointItem(type_='max',symbol='pin',symbol_size=50),
opts.MarkPointItem(type_='min')
]
),
markline_opts=opts.MarkLineOpts(
data=[
opts.MarkLineItem(type_='average')
],
label_opts=opts.LabelOpts(color='red')
)
)
)
c.render_notebook()
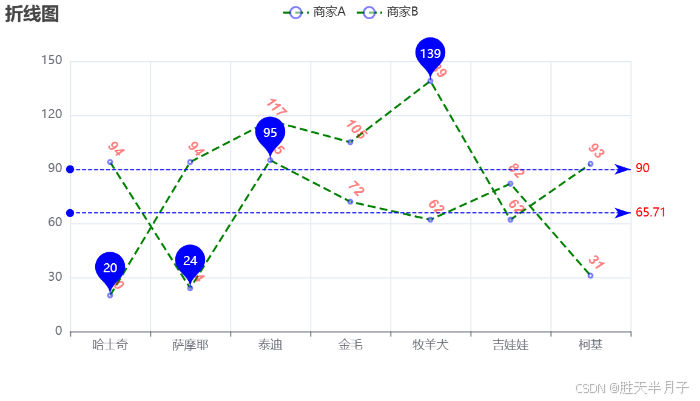
- 效果


 1328
1328

 被折叠的 条评论
为什么被折叠?
被折叠的 条评论
为什么被折叠?
 到【灌水乐园】发言


