


一、决策树简述
决策树(Decision Tree)是一种分类和回归方法,是基于各种情况发生的所需条件构成决策树,以实现期望最大化的一种图解法。由于这种决策分支画成图形很像一棵树的枝干,故称决策树。
二、原理
1.计算熵值函数
%计算熵的值
function entropy = calculateEntropy(labels)
    uniqueLabels = unique(labels);
    entropy = 0;
    for i = 1:length(uniqueLabels)
        %计算Y值中各类占的比例p
        p = sum(strcmp(labels, uniqueLabels{i})) / length(labels);
        %通过公式- p * log2(p)累加求和得到最终的熵值
        entropy = entropy - p * log2(p);
    end
end
2.实现分裂逻辑
function [gain, splitValue] = bestSplit(data, featureIndex)
    values = data(:, featureIndex);
    labels = data(:, end);

    %计算初始的熵值
    originalEntropy = calculateEntropy(labels);
    %初始化最小熵值、分裂值和熵值减小值
    minEntropy = inf; splitValue = 0; gain = 0;

    %循环遍历每一个该属性x的值作为分裂值,选择熵值最小的时刻对应的分裂值为最终分裂值
    for value = unique(values).'
        left = labels(values < value);
        right = labels(values >= value);

        entropy = (length(left)/length(labels)) * calculateEntropy(left) + ...
                  (length(right)/length(labels)) * calculateEntropy(right);

        if entropy < minEntropy
            minEntropy = entropy;
            splitValue = value;
        end
    end

    gain = originalEntropy - minEntropy;
end
3.递归构建决策树并执行预剪枝操作
function tree = buildTree(data, depth, maxDepth)
    if depth == maxDepth || all(strcmp(data(:,end), data(1,end))) || size(data, 1) < min_mount
        % 达到最大深度或所有标签相同或者到该分支的数据个数小于划定的最小值(即预剪枝),返回叶节点
        tree.isLeaf = true;
        tree.label = mode(data(:,end));
        return
    end

    %cellfun函数将后面的cell广义数组中的每一项带入bestSplit函数得到返回值矩阵
    %通过max函数找到熵值减小量最大的属性x的位置
    [~, splitFeature] = max(cellfun(@(x) bestSplit(data, x), num2cell(1:size(data,2)-1)));
    [gain, splitValue] = bestSplit(data, splitFeature);

    if gain == 0
        % 无法再分裂,返回叶节点
        tree.isLeaf = true;
        tree.label = mode(data(:,end));
        return
    end

    tree.isLeaf = false;
    tree.splitFeature = splitFeature;
    tree.splitValue = splitValue;
    %递归继续构建当前结点下的左右子树,通过bestSplit函数选择的分裂值筛选
    tree.left = buildTree(data(data(:,splitFeature) < splitValue,:), depth+1, maxDepth);
    tree.right = buildTree(data(data(:,splitFeature) >= splitValue,:), depth+1, maxDepth);
end
三、应用
1.代码
以Fisher 1936 年的鸢尾花数据为例,构建决策树。对比测试数据的预测值与实际值确定该决策树的精准度。
clear
clc
%传入数据
load fisheriris.mat
% 特征变量
X = meas; % 150x4 的数组,每行代表一个样本,每列是一个特征
% 目标变量(标签)
Y = species; % 150x1 的细胞数组,每个元素是表示样本所属类别的字符串
%划分训练集和测试集
index = randperm(150);
train_X = X(index(1 : 120), :);
train_Y = Y(index(1 : 120), :);
test_X = X(index(121 : end), :);
test_Y = Y(index(121 : end), :);
%构建决策树
ctree = ClassificationTree.fit(train_X, train_Y);
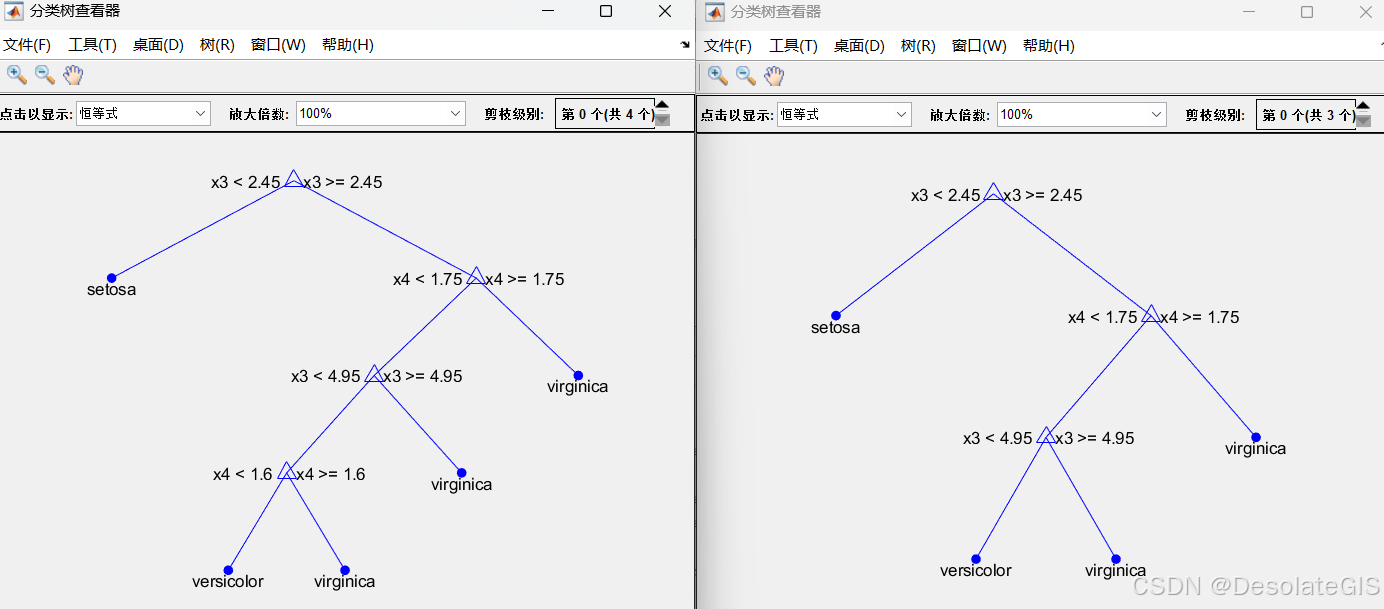
%绘制决策树图形
view(ctree);
view(ctree, 'Mode', 'graph');
%测试数据
sim_Y = predict(ctree, test_X);
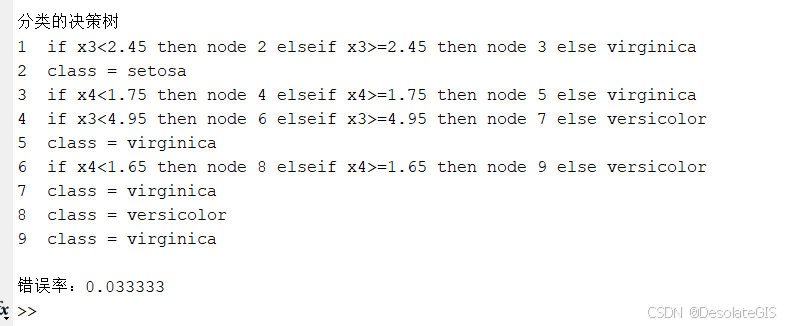
%对比测试数据的预测值与实际值,计算错误率
index_Y = ~strcmp(sim_Y, test_Y);
error = sum(index_Y) / size(test_X, 1);
disp(['错误率:', num2str(error)]);
%后剪枝操作
treePruned = prune(ctree, 'level',1);
view(treePruned, 'Mode', 'graph');
2.运行结果


 829
829

 被折叠的 条评论
为什么被折叠?
被折叠的 条评论
为什么被折叠?
 到【灌水乐园】发言


