


一、B 样条曲线简介
B 样条曲线(Basis Spline)是计算机图形学中广泛使用的曲线表示方法,具有局部控制、灵活平滑等特点。相较于贝塞尔曲线,B 样条通过节点向量和基函数的组合,能够在不提高阶数的情况下生成复杂曲线,适用于CAD、动画路径等场景。
二、核心概念解析
 // 定义点集
 TColgp_Array1OfPnt demoPoints(1, 4);

 // 填充点数据
 demoPoints(1) = gp_Pnt(3, 5, 0);
 demoPoints(2) = gp_Pnt(4, 6, 0);
 demoPoints(3) = gp_Pnt(1, 7, 0);
 demoPoints(4) = gp_Pnt(7, 3, 0);

 /*
 在 B 样条曲线中,**最低度数(DegMin)和最高度数(DegMax)**指定了曲线的阶数(即曲线的多项式度数)。
 在 GeomAPI_PointsToBSpline 中,这两个参数用于定义生成的 B 样条曲线的度数范围。

 解释:
 DegMin:定义了 B 样条曲线的最低度数。这是 B 样条的一种限制,表示生成的曲线的多项式阶数不能低于此值。
 DegMax:定义了 B 样条曲线的最高度数。它指定了生成曲线的最高度数,
         通常在给定的点集和容差条件下,生成的曲线可能会是该度数或者低于该度数。
 */
 // 定义最低和最高度数
 Standard_Integer DegMin_demo = 2;
 Standard_Integer DegMax_demo = 3;

 // 设置连续性(C2 连续性)
 GeomAbs_Shape Continuity_demo = GeomAbs_C2;

 // 设置容差(可以根据需要调整)
 Standard_Real Tol_demo = 1e-6;

 // 使用 GeomAPI_PointsToBSpline 近似点集并生成 B 样条曲线
 GeomAPI_PointsToBSpline Approx(demoPoints, DegMin_demo, DegMax_demo, Continuity_demo, Tol_demo);

 // 获取生成的 B 样条曲线
 Handle(Geom_BSplineCurve) bsplineCurve = Approx.Curve();

 // 创建 Edge(曲线的拓扑表示)
 BRepBuilderAPI_MakeEdge makeEdge(bsplineCurve);

 // 获取拓扑形状
 TopoDS_Shape shape = makeEdge.Shape();

 // 创建 AIS_Shape
 Handle(AIS_Shape) aisShape = new AIS_Shape(shape);
 aisShape->SetColor(COLOR_RED);

 // 将 AIS_Shape 添加到上下文中
 context->Display(aisShape, Standard_True);
控制点(Control Points)
定义曲线形状的关键点,曲线会被拉向这些点,但不一定经过所有点。示例代码中定义了 4 个控制点:
TColgp_Array1OfPnt demoPoints(1, 4);
demoPoints(1) = gp_Pnt(3, 5, 0);  // 点1
demoPoints(2) = gp_Pnt(4, 6, 0);  // 点2
demoPoints(3) = gp_Pnt(1, 7, 0);  // 点3
demoPoints(4) = gp_Pnt(7, 3, 0);  // 点4
度数(Degree)
阶数(Order) = 度数(Degree) + 1,表示曲线段的多项式次数。
DegMin 和 DegMax:分别定义生成曲线的最低和最高度数限制。代码中设置为 2 和 3,允许曲线在二次或三次多项式间自动选择:
Standard_Integer DegMin_demo = 2;  // 最低度数
Standard_Integer DegMax_demo = 3;  // 最高度数
DegMin 和 DegMax 定义了算法生成曲线时允许的度数范围。它们的核心意义如下:
-
DegMin(最低度数)- 强制约束:确保生成的曲线度数不低于此值。
- 避免过于简单化:防止算法因容差过大生成低质量曲线。
Standard_Integer DegMin_demo = 2; // 强制曲线至少为二次 -
DegMax(最高度数)- 灵活性限制:算法会尝试在不超过此值的范围内选择最优度数。
- 平衡性能与质量:避免因高度数导致计算资源浪费。
Standard_Integer DegMax_demo = 3; // 最高允许三次曲线
连续性(Continuity)
描述曲线连接处的光滑程度。GeomAbs_C2 表示二阶导数连续(曲率连续),适用于高质量曲面:
GeomAbs_Shape Continuity_demo = GeomAbs_C2;
容差(Tolerance)
允许的拟合误差范围,较小的容差会提高精度但增加计算量:
Standard_Real Tol_demo = 1e-6;
三、Open CASCADE 实现步骤
以下代码演示了如何通过控制点生成并显示 B 样条曲线:
- 定义控制点
创建包含 4 个点的数组:
TColgp_Array1OfPnt demoPoints(1, 4);
demoPoints(1) = gp_Pnt(3, 5, 0);  // 点1
demoPoints(2) = gp_Pnt(4, 6, 0);  // 点2
demoPoints(3) = gp_Pnt(1, 7, 0);  // 点3
demoPoints(4) = gp_Pnt(7, 3, 0);  // 点4
- 配置参数
设置曲线参数,包括度数范围和连续性:
Standard_Integer DegMin_demo = 2;
Standard_Integer DegMax_demo = 3;
GeomAbs_Shape Continuity_demo = GeomAbs_C2;
Standard_Real Tol_demo = 1e-6;
- 生成 B 样条曲线
使用 GeomAPI_PointsToBSpline 将点集拟合成曲线:
GeomAPI_PointsToBSpline Approx(demoPoints, DegMin_demo, DegMax_demo, Continuity_demo, Tol_demo);
Handle(Geom_BSplineCurve) bsplineCurve = Approx.Curve();
- 创建可视化对象
将曲线转换为拓扑形状并显示:
BRepBuilderAPI_MakeEdge makeEdge(bsplineCurve);  // 创建边
TopoDS_Shape shape = makeEdge.Shape();           // 获取形状

Handle(AIS_Shape) aisShape = new AIS_Shape(shape);
aisShape->SetColor(Quantity_NOC_RED);            // 设置颜色
context->Display(aisShape, Standard_True);       // 显示
四、参数影响分析
- 输入控制点数量为 4,满足三次曲线的最低要求(( 3+1=4 ))。
- 算法会在二次(Degree=2)和三次(Degree=3)之间选择:
- 若容差(
Tol_demo=1e-6)允许,可能优先选择三次曲线以获得更高平滑性(C2 连续)。 - 若控制点分布无法满足三次曲线拟合精度,则回退到二次曲线。
- 若容差(
度数选择:
低度数(如 2)曲线更简单,但灵活性低;高度数(如 3)更平滑,但需要更多控制点。
连续性:
C2 连续性确保曲率平滑,适用于机械设计;若只需视觉平滑,可选择 C1。
容差调整:
增加容差可能减少计算时间,但会降低拟合精度。
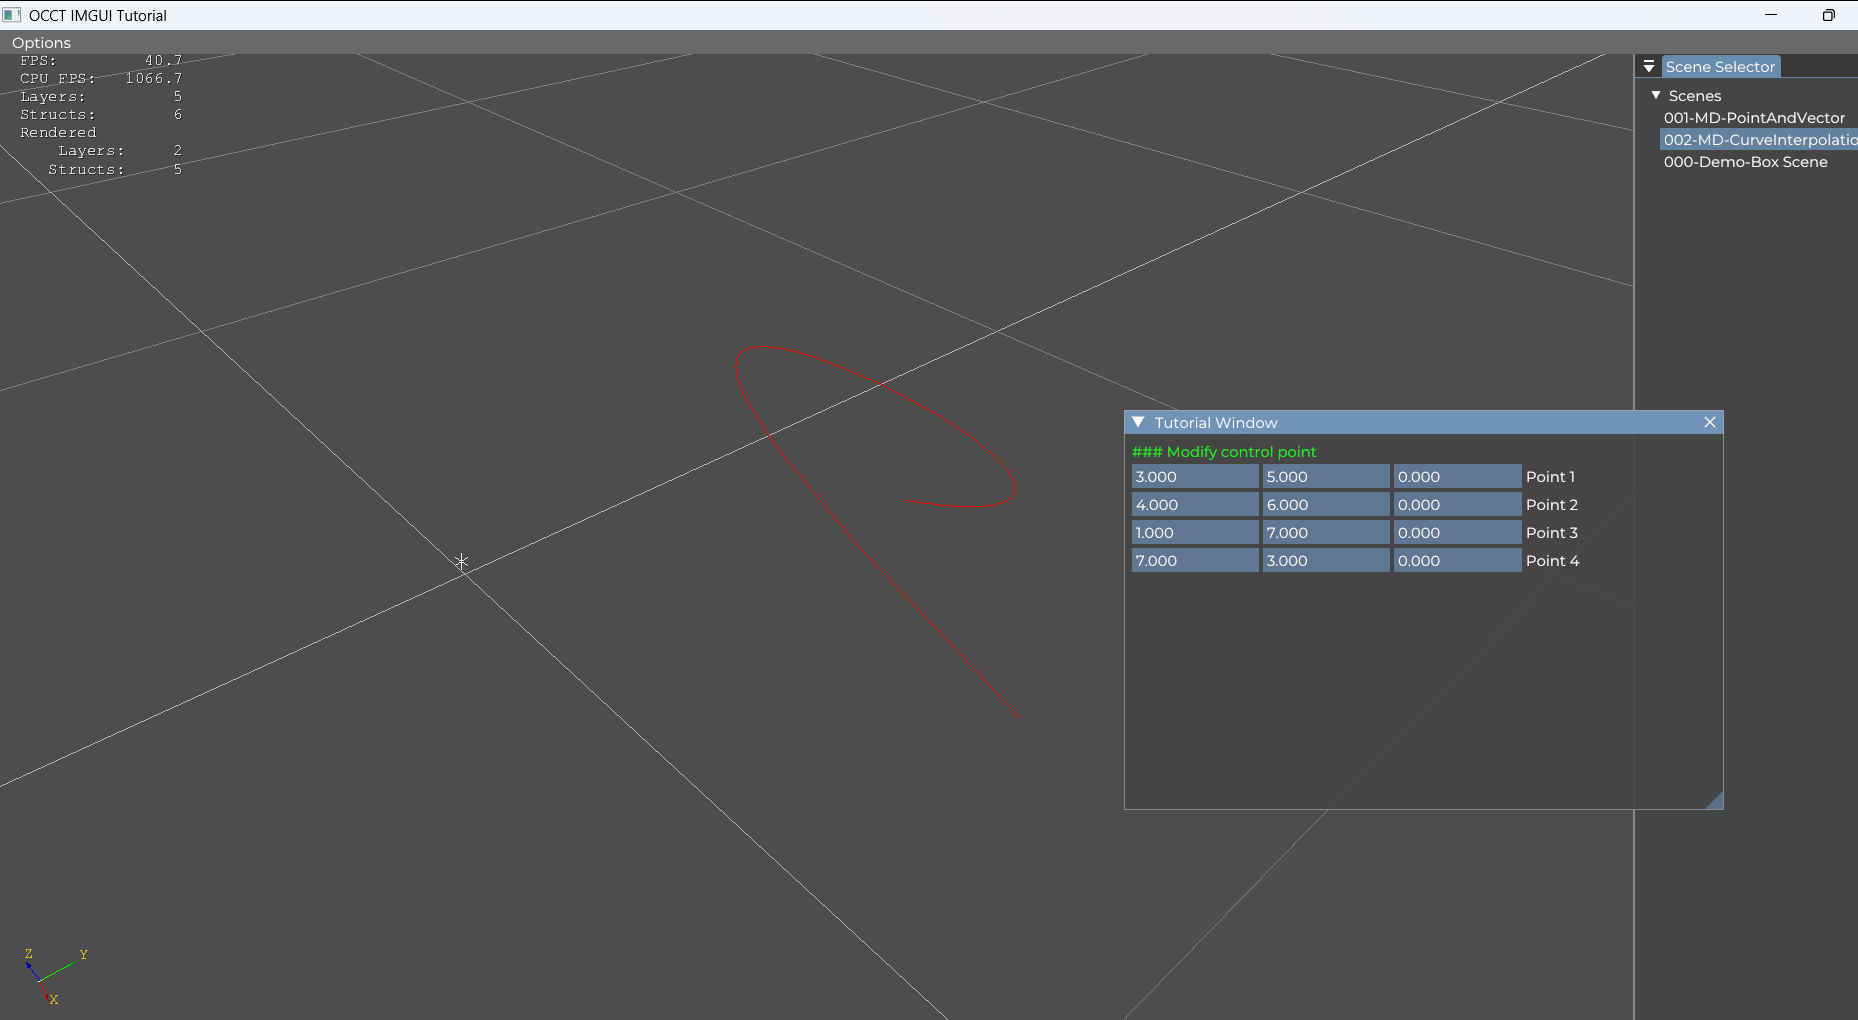
五、实例效果
通过上述代码生成的曲线会根据控制点位置呈现平滑过渡。调整 demoPoints 的坐标可实时改变曲线形态,体现了 B 样条的局部控制特性。


交互代码
参考上一篇文章:【OCCT+ImGUI系列】feat:增加教学交互窗口 ,替换对应代码可实现交互。
    // 教学类窗口
    // 自定义初始化教中学窗口
    void customInitTutorialWindow(const Handle(AIS_InteractiveContext)& context) override {
        // 初始化显示坐标
        pointCoordinates = std::vector<std::vector<float>>(4, std::vector<float>(3));
        previousPointCoordinates = std::vector<std::vector<float>>(4, std::vector<float>(3));  // 用于存储前一次的坐标

        // 默认填充四个点的初始坐标
        points = TColgp_Array1OfPnt(1, 4);
        points(1) = gp_Pnt(3, 5, 0);
        points(2) = gp_Pnt(4, 6, 0);
        points(3) = gp_Pnt(1, 7, 0);
        points(4) = gp_Pnt(7, 3, 0);

        // 使用 GeomAPI_PointsToBSpline 近似点集并生成 B 样条曲线
        GeomAPI_PointsToBSpline Approx(points, DegMin, DegMax, Continuity, Tol);

        // 获取生成的 B 样条曲线
        Handle(Geom_BSplineCurve) bsplineCurve = Approx.Curve();

        // 创建 Edge(曲线的拓扑表示)
        BRepBuilderAPI_MakeEdge makeEdge(bsplineCurve);

        // 获取拓扑形状
        TopoDS_Shape shape = makeEdge.Shape();

        // 创建 AIS_Shape
        tutorialAisShape = new AIS_Shape(shape);

        tutorialAisShape->SetColor(Quantity_NOC_RED);  // 设置颜色为红色

        context->Display(tutorialAisShape, Standard_True);
    }

    // 教学窗口渲染内容
    void renderTutorialContent(const Handle(AIS_InteractiveContext)& context) override {
        // 重置修改检查标志位
        bool pointsChanged = false;

        // 填充点的初始坐标
        for (int i = 0; i < 4; ++i) {
            pointCoordinates[i][0] = static_cast<float>(points[i + 1].X());
            pointCoordinates[i][1] = static_cast<float>(points[i + 1].Y());
            pointCoordinates[i][2] = static_cast<float>(points[i + 1].Z());
        }

        // 使用 ImGui::InputFloat3 控制四个点的坐标
        ImGui::TextColored(ImVec4(0.0f, 1.0f, 0.0f, 1.0f), "### Modify control point");
        ImGui::InputFloat3("Point 1", pointCoordinates[0].data());
        ImGui::InputFloat3("Point 2", pointCoordinates[1].data());
        ImGui::InputFloat3("Point 3", pointCoordinates[2].data());
        ImGui::InputFloat3("Point 4", pointCoordinates[3].data());

        // 检查是否有坐标变化
        for (int i = 0; i < 4; ++i) {
            if (!arePointsEqual(pointCoordinates[i], previousPointCoordinates[i])) {
                pointsChanged = true;
                break;
            }
        }

        // 如果坐标发生变化,更新控制点和 TColgp_Array1OfPnt
        if (pointsChanged) {
            for (int i = 0; i < 4; ++i) {
                // 更新控制点
                points(i + 1) = gp_Pnt(pointCoordinates[i][0], pointCoordinates[i][1], pointCoordinates[i][2]);
                // 更新 previousPointCoordinates
                previousPointCoordinates[i] = pointCoordinates[i];
            }

            // 使用 GeomAPI_PointsToBSpline 重新生成 B 样条曲线
            GeomAPI_PointsToBSpline Approx(points, DegMin, DegMax, Continuity, Tol);
            Handle(Geom_BSplineCurve) bsplineCurve = Approx.Curve();

            // 创建新的 Edge
            BRepBuilderAPI_MakeEdge makeEdge(bsplineCurve);
            TopoDS_Shape shape = makeEdge.Shape();

            // 更新 AIS_Shape
            tutorialAisShape->SetShape(shape);

            // 刷新显示
            context->Redisplay(tutorialAisShape, Standard_True);
        }
    }


 3162
3162

 被折叠的 条评论
为什么被折叠?
被折叠的 条评论
为什么被折叠?
 到【灌水乐园】发言


