


 本文详细介绍了使用Python的Matplotlib库进行数据可视化的方法,包括如何创建基本的折线图和散点图,设置图表样式,调整刻度标记大小等。通过实例展示了如何使用plot和scatter函数,以及如何自定义图表的标题、轴标签和刻度参数。
matplotlib Python的绘图库
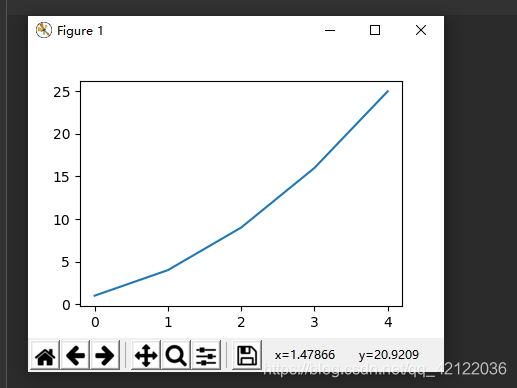
plot(list) 函数:将列表中的值设为 y轴的范围,x轴从0开始
show() 函数:查看绘制出的图形
# -*- coding: utf-8 -*-

import matplotlib.pyplot as plt

squares = [1, 4, 9, 16, 25]
plt.plot(squares)
plt.show()
散点图
x_values = [1, 2, 3, 4, 5]
y_values = [1, 4, 9, 16, 25]
# plt.scatter(2, 4, s=200)  # 坐标(2,4)绘制一个点  s参数是点的尺寸
plt.scatter(x_values, y_values, c='red', s=200)
# 坐标(2,4)绘制一个点  s参数是点的尺寸  c='red' 散点颜色
# 设置图标标题
plt.title('Square Numbers', fontsize=24)
plt.xlabel('Value', fontsize=14)
plt.ylabel('Square of Value', fontsize=14)
# 设置刻度标记的大小
plt.tick_params(axis='both', which='major', labelsize=14)  # 参数which有三种刻度,major主刻度线,minor副刻度线,both
plt.show()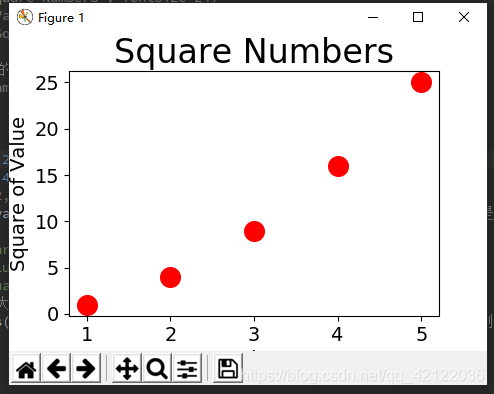
x_values = list(range(1,1001))
y_values = [x**2 for x in x_values]
其他相同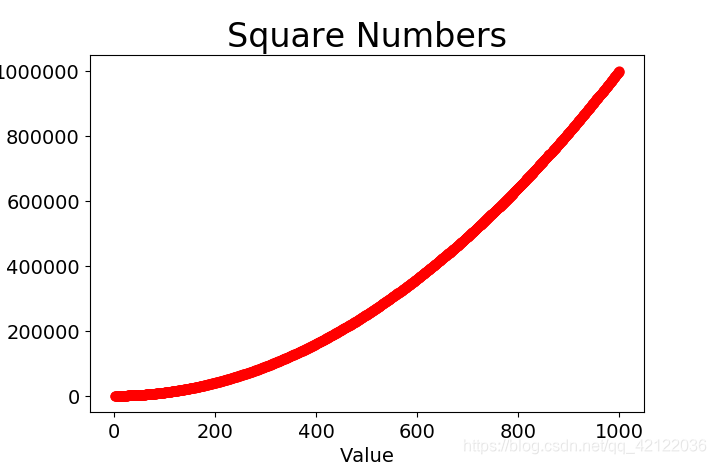


 2万+
2万+

 被折叠的 条评论
为什么被折叠?
被折叠的 条评论
为什么被折叠?
 到【灌水乐园】发言


