


本案例取自工廠測試,下面介紹一下測試背景以及需求:
測試幾台為Android device,機器背部安裝有scanner掃描頭,可以發出紅色的LED光。
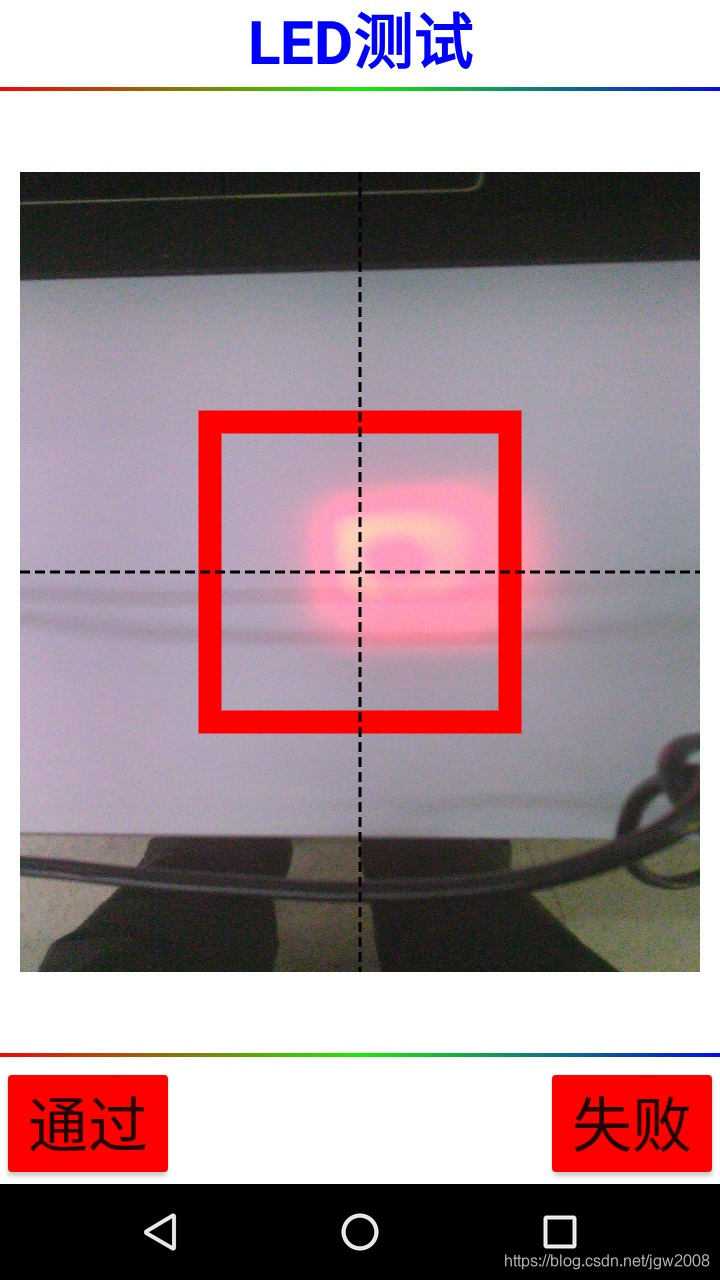
測試要求:在camera preview的時候,同時打開Scanner LED(紅色),要求Scanner LED需要落在規定的區域內(本例是要求落在紅色的矩形框內),如果scanner Led落在中間的紅色矩形框內則說明scanner安裝正確。測試UI如下。
目前,測試的PASS/Fail需要人工判斷,是否有可能利用CV相關的技術來判定PASS或Fail呢?
下面是關於這個問題的探討,歡迎老鳥來噴。
下面是構想以及主要用到的技術:
1. 通過PC獲取如上圖的preview截圖;
2. 加載測試照片;
3. 截取中間部分圖片(主要分析的圖像區域在中間);
4. 使用OpenCV的color range,提取紅色LED的區域,並生成灰度圖;
5. 將紅色矩形框內填充黑色(第4步後,Scanner LED被標識成白色,其餘部分被標識為黑色);
6. 計算目前圖片(即紅色矩形外的區域)還有多少scanner LED的像素點;超過一定的像素點則fail,否則pass。
下面是測試部分,測試是在Python3+OpenCV環境下完成,編輯器使用jupyter notebook。
下面一起看看代碼實現部分,
一、通過PC獲取如上圖的preview截圖
這部分比較簡單,可以通過adb命令來實現screenshot和pull的動作,在此不做贅述;
二、加載測試圖片
這部分也比較簡單,很多代碼都可以參考;如果截圖是png格式,則需要轉成jpg格式再加載,opencv默認加載為BGR格式,需要我們再轉成RGB格式,代碼如下,
import cv2
import numpy as np

import matplotlib.pyplot as plt
from matplotlib import colors

from mpl_toolkits.mplot3d import Axes3D
from matplotlib.colors import hsv_to_rgb

# To get a list of all the possible colour conversions
flags = [i for i in dir(cv2) if i.startswith("COLOR_")]
print(len(flags), "flags total:")
print(flags[40])

# Load the scanner LED picture
img_ori = cv2.imread("./LEDCapture/2.jpg")
plt.imshow(img_ori)
plt.show()
OpenCV默認加載為BGR,需要再做轉換,代碼如下,
# OpenCV by default opens images in BGR color space, convert to RGB
img_ori = cv2.cvtColor(img_ori, cv2.COLOR_BGR2RGB)
plt.imshow(img_ori)
plt.show()
三、截取中間部分圖片,這是我們分析的主要圖片區域
# We only care the center of the picture
img_slice = img_ori[300:800, 100:600]
plt.imshow(img_slice)
plt.show()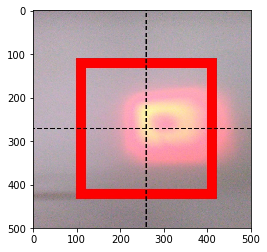
其中img_ori[300:800, 100:600],(Y上坐標:Y下坐標,X左坐標:X右坐標)。
下面看看RGB圖像在3D圖形上的分佈,
# Plotting the image on 3D plot

r, g, b = cv2.split(img_slice)

fig = plt.figure()
axis = fig.add_subplot(1, 1, 1, projection="3d")
pixel_colors = img_slice.reshape((np.shape(img_slice)[0] * np.shape(img_slice)[1], 3))
norm = colors.Normalize(vmin=-1.0, vmax=1.0)
norm.autoscale(pixel_colors)
pixel_colors = norm(pixel_colors).tolist()

axis.scatter(
    r.flatten(), g.flatten(), b.flatten(), facecolors=pixel_colors, marker="."
)
axis.set_xlabel("Red")
axis.set_ylabel("Green")
axis.set_zlabel("Blue")
plt.show()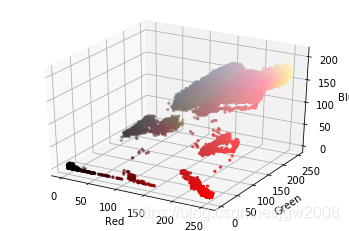
下面再看看HSV格式在3D圖上的顯示,
hsv_img_slice = cv2.cvtColor(img_slice, cv2.COLOR_RGB2HSV)

h, s, v = cv2.split(hsv_img_slice)

fig = plt.figure()
axis = fig.add_subplot(1, 1, 1, projection="3d")

axis.scatter(
    h.flatten(), s.flatten(), v.flatten(), facecolors=pixel_colors, marker="."
)
axis.set_xlabel("Hue")
axis.set_ylabel("Saturation")
axis.set_zlabel("Value")
plt.show()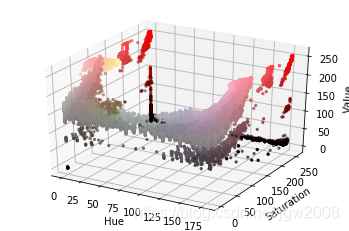
仔細看這張HSV的圖,我們將從這張圖上找到Scanner LED的顏色,並取出Scanner LED紅色區域
四、使用OpenCV的color range,提取紅色LED的區域,並生成灰度圖
這一步比較關鍵的是選取Scanner LED的color range,可以從上面的HSV三維圖上選取。我有試著利用GIMP選取顏色,但是和OpenCV的標準不一樣,不知是不是HSV的標準也有很多種,這個以後可以再研究。下面是的代碼,
light_red = (150, 50, 50)
dark_red = (175, 245, 245)

# Normalise to 0 - 1 range for viewing

lr_square = np.full((10, 10, 3), light_red, dtype=np.uint8) / 255.0
dr_square = np.full((10, 10, 3), dark_red, dtype=np.uint8) / 255.0

plt.subplot(1, 2, 1)
plt.imshow(hsv_to_rgb(dr_square))
plt.subplot(1, 2, 2)
plt.imshow(hsv_to_rgb(lr_square))
plt.show()
至於為什麼dark_red選成了藍顏色,而light_red選成了淺灰?這個值的選取應該不准,但是根據結果來看,這個值的範圍選擇的還是比較成功的。
# Segment LED using inRange() function

mask = cv2.inRange(hsv_img_slice, light_red, dark_red)

# Bitwise-AND mask and original image

result = cv2.bitwise_and(img_slice, img_slice, mask=mask)

# Convert back to RGB in order to plot using `matplotlib.pyplot`

plt.subplot(1, 2, 1)
plt.imshow(mask, cmap="gray")
plt.subplot(1, 2, 2)
plt.imshow(result)
plt.show()
上面是通過color range選擇得出的scaner LED的範圍,選取基本還是可以接受的,但是還有很大的改進空間。不知道如果通過機器學習來做的話,會不會更好。
五、將紅色矩形框內填充黑色(第4步後,Scanner LED被標識成白色,其餘部分被標識為黑色);
我們是要判斷scanner led是否在規定的矩形範圍內;反過來想,如果scanner led超出了矩形範圍,則是fail的。所以,我們先把矩形範圍(測試標準內的範圍)先標記為黑色,則剩餘部分的顏色則為超出範圍的顏色,這樣問題就好解決了。
# Fill the black color in the rectangle which defined in the spec
# Then we can know how many scan led is out of range
cv2.rectangle(mask,(100,100),(420,430),(0,0,0),-1)
plt.subplot(1, 2, 1)
plt.imshow(mask, cmap="gray")
plt.show()
運行結果如上圖,圖中有少許的噪點,但是基本不影響結果的判斷。
六、 計算目前圖片(即紅色矩形外的區域)還有多少scanner LED的像素點;超過一定的像素點則fail,否則pass。
這一步是計算白色的點有多少,當超過一定的閥值,就是fail,至於閥值多少是合理的,則需要反复試驗,這裡,我選取500作為閥值。
# Let's count how many pixel is out the range
#np.set_printoptions(threshold=np.nan)
#print(mask)
(row, column)=mask.shape
count_out_of_range=0
for i in range(row):
    for j in range(column):
        #print(mask[i,j])
        if mask[i,j]==255:
            count_out_of_range=count_out_of_range+1
print("pixel out of range number is %d" %count_out_of_range)

# Assume the test criteria is <=500 for pass, and >500 for fail
if count_out_of_range > 500:
    print("Test Fail")
else:
    print("Test PASS")
最終的測試結果是:
pixel out of range number is 2609
Test Fail
小結:這是一例運用color space解決實際生產的典型案例,其他的一些問題,如攝像頭的閃光燈功能測試/充電LED測試/LCD顏色測試,等等,都可以考慮採用本例類似的思路。
參考資料:https://realpython.com/python-opencv-color-spaces/


 1046
1046

 被折叠的 条评论
为什么被折叠?
被折叠的 条评论
为什么被折叠?
 到【灌水乐园】发言


