


 本文介绍了一个使用Python和Matplotlib库实现的3D绘图函数,plot3dproj,它支持二维投影并应用Lighter函数调整颜色。通过实例展示了如何读取数据并创建带有阴影效果和自定义视角的三维轨迹图。
plt.close('all')
def lighter(clr, f=1/3):
"""
An implementation of Mathematica's Lighter[]
function for RGB colors
clr : 3-tuple or list, an RGB color
f : float, the fraction by which to brighten
"""
gaps = [f*(1 - val) for val in clr]
new_clr = [val + gap for gap, val in zip(gaps, clr)]
return new_clr
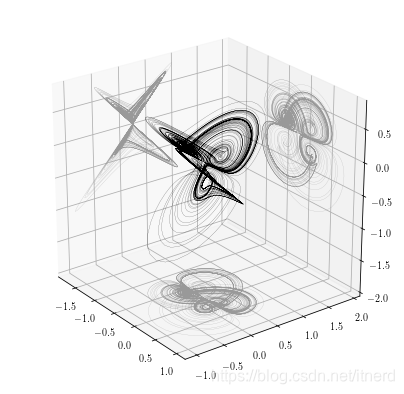
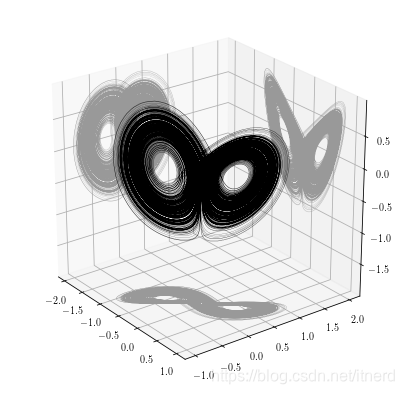
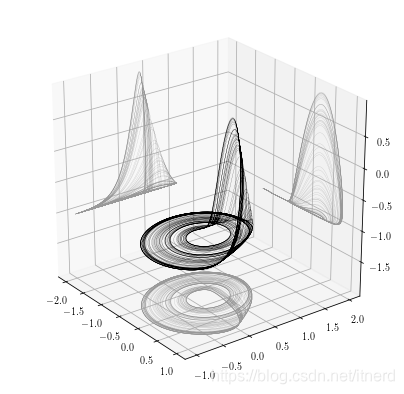
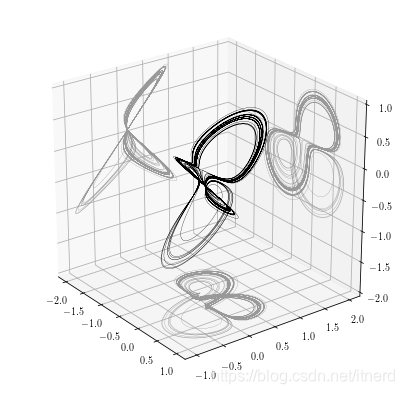
def plot3dproj(x, y, z, *args, color=(0,0,0), shadow_dist=1.0, color_proj=None,
elev_azim=(39,-47), show_labels=True, **kwargs):
"""
Create a three dimensional plot, with projections onto the 2D coordinate
planes
Parameters
----------
x, y, z : 1D arrays of coordinates to plot
*args : arguments passed to the matplotlib plt.plot functions
- color : length-3 tuple
The RGB color (with each element in [0,1]) to use for the
three dimensional line plot
- color_proj : length-3 tuple
The RGB color (with each element in [0,1]) to use for the
two dimensional projection plots. Defaults to a lighter version of the
plotting color
- shadow_dist : float
The relative distance of axes to their shadow. If a single value,
then the same distance is used for all three axies. If a triple, then
different values are used for all axes
- elev_azim : length-2 tuple
The starting values of elevation and azimuth when viewing the figure
- show_labels : bool
Whether to show numerical labels on the axes
"""
if not color_proj:
color_proj = lighter(color, .6)
if np.isscalar(shadow_dist) == 1:
sdist_x = shadow_dist
sdist_y = shadow_dist
sdist_z = shadow_dist
else:
sdist_x, sdist_y, sdist_z = shadow_dist
fig = plt.figure(figsize=(7,7))
ax = fig.add_subplot(111, projection= '3d')
ax.plot(x, z, *args, zdir='y', zs=sdist_y*np.max(y), color=color_proj, **kwargs)
ax.plot(y, z, *args, zdir='x', zs=sdist_x*np.min(x), color=color_proj, **kwargs)
ax.plot(x, y, *args, zdir='z', zs=sdist_z*np.min(z), color=color_proj, **kwargs)
ax.plot(x, y, z, *args, color=color, **kwargs)
ax.view_init(elev=elev_azim[0], azim=elev_azim[1])
ax.set_aspect('auto', adjustable='box')
if not show_labels:
ax.set_xticklabels([])
ax.set_yticklabels([])
ax.set_zticklabels([])
return ax
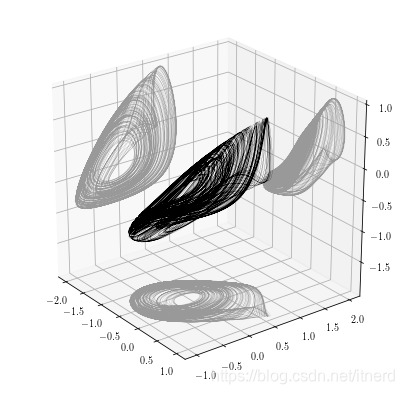
x = np.loadtxt('dataset/trajectories.txt', delimiter=',')[:50000]
plt.figure()
plot3dproj(x[:,0], x[:,1], x[:,2], shadow_dist=2, elev_azim=(25,-37), linewidth=.15)
plt.show()
参考:https://github.com/jennieJiang/fnn


 1068
1068


 到【灌水乐园】发言


