


 本文是一篇关于Python箱型图的教程,介绍了如何使用matplotlib和pandas库创建箱型图,包括设置上下限、中位数、颜色,并提供详细的学习参数。
箱型图比较复杂,这里只做简要介绍。
声明:
- 需要读者了解Python列表
- 最好了解Python的pandas库
- 教程借助于matplotlib绘图库
箱型图
简单箱型图
boxplot()import matplotlib.pyplot as plt
fig = plt.figure() # 创建画布
ax = plt.subplot() # 创建作图区域
# 蓝色矩形的红线:50%分位点是4.5,上边沿:25%分位点是2.25,下边沿:75%分位点是6.75
ax.boxplot([range(5), range(10), range(20)])
plt.show()
箱型图的上下限
whisimport matplotlib.pyplot as plt
fig = plt.figure() # 创建画布
ax = plt.subplot() # 创建作图区域
ax.boxplot([range(5), range(10), range(20)], whis=[5, 95]) # 设置最大值不超过95分位点;最小值不小于5%分位点。
plt.show()
箱型图的中位数
notch,设置x轴下标,添加网格横线import matplotlib.pyplot as plt
fig = plt.figure() # 创建画布
ax = plt.subplot() # 创建作图区域
# 缺口表示50%分位点的置信区间,缺口太大表示分布太分散了
ax.boxplot([range(5), range(10), range(20)], notch=True)
# 修改x轴下标
ax.set_xticks([1, 2, 3])
ax.set_xticklabels(['first', 'second', 'third'])
# 显示y坐标轴的底线
plt.grid(axis='y')
plt.show()
箱型图上色
patch_artist, labelsimport matplotlib.pyplot as plt
import numpy as np
np.random.seed(19680801)
all_data = [np.random.normal(0, std, size=100) for std in range(1, 4)]
labels = ['x1', 'x2', 'x3']
bplot = plt.boxplot(all_data, patch_artist=True, labels=labels) # 设置箱型图可填充
plt.title('Rectangular box plot')
colors = ['pink', 'lightblue', 'lightgreen']
for patch, color in zip(bplot['boxes'], colors):
patch.set_facecolor(color) # 为不同的箱型图填充不同的颜色
plt.yaxis.grid(True)
plt.xlabel('Three separate samples')
plt.ylabel('Observed values')
plt.show()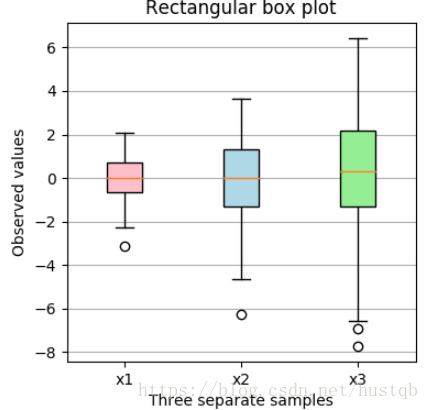
pandas内含的绘图函数
import matplotlib.pyplot as plt
import pandas as pd
df = pd.DataFrame({'first': range(5) + [None] * 15, 'second': range(10) + [None] * 10, 'third': range(20)})
print df
df.plot(kind='box', notch=True, grid=True)
plt.show()


 2万+
2万+


 到【灌水乐园】发言


