


1. 引言:性能优化在现代应用中的重要性
在当今高速发展的数字时代,应用性能直接影响用户体验、业务转化率和系统可靠性。一个响应缓慢的应用不仅会导致用户流失,还可能造成巨大的商业损失。研究表明,页面加载时间每增加1秒,转化率就会下降7%,而超过3秒的延迟会导致40%的用户放弃使用。
Spring生态系统提供了一套完整的性能监控和优化解决方案,从代码级别的优化建议到生产环境的实时监控,帮助开发者构建高性能、高可用的应用程序。
比喻:应用性能优化就像F1赛车的调校过程。监控系统(如Actuator)是车上的传感器和仪表盘,实时收集各项数据;优化技巧则是工程师根据数据进行的精准调校,包括发动机调优(代码优化)、空气动力学改进(架构优化)和轮胎选择(资源配置),最终目标是让赛车在赛道上发挥最佳性能。
2. Spring性能监控体系
2.1 Spring Boot Actuator:应用监控的核心
Spring Boot Actuator是Spring生态中最重要的监控工具,它提供了丰富的生产就绪特性:
<dependency>
    <groupId>org.springframework.boot</groupId>
    <artifactId>spring-boot-starter-actuator</artifactId>
</dependency>
<dependency>
    <groupId>io.micrometer</groupId>
    <artifactId>micrometer-registry-prometheus</artifactId>
</dependency>
基础配置:
management:
  endpoints:
    web:
      exposure:
        include: health, info, metrics, prometheus
  endpoint:
    health:
      show-details: always
    metrics:
      enabled: true
  metrics:
    export:
      prometheus:
        enabled: true
    tags:
      application: ${spring.application.name}
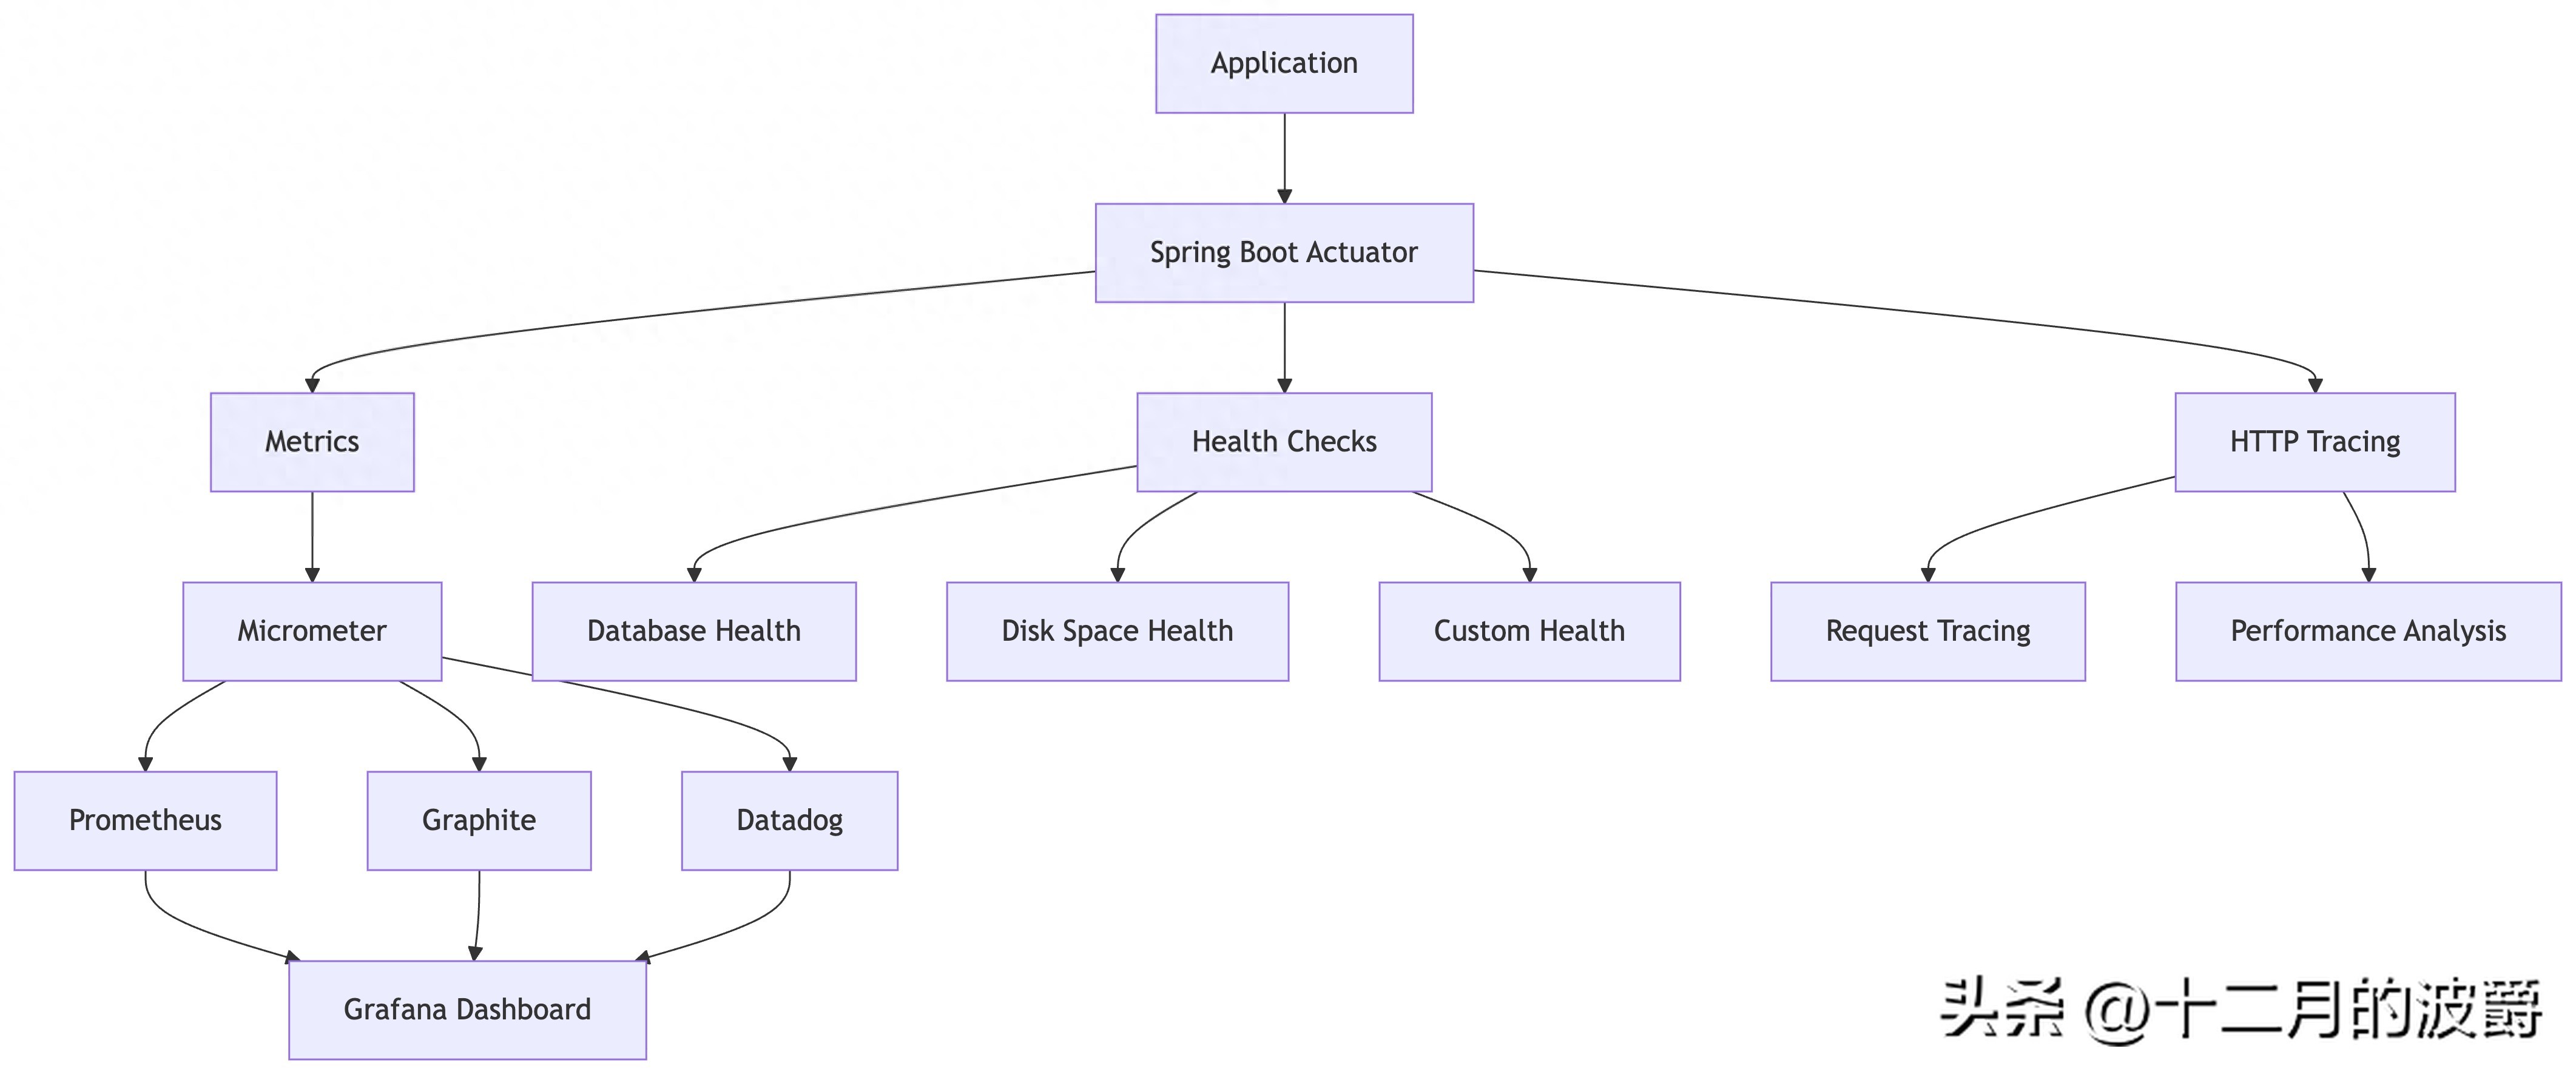
2.2 监控体系架构
Spring性能监控体系采用分层架构,如下图所示:
3. 实战演练:构建完整的监控体系
3.1 应用健康监控
自定义健康检查指示器:
@Component
public class CustomHealthIndicator extends AbstractHealthIndicator {

    private final DatabaseService databaseService;
    private final CacheService cacheService;

    public CustomHealthIndicator(DatabaseService databaseService, CacheService cacheService) {
        this.databaseService = databaseService;
        this.cacheService = cacheService;
    }

    @Override
    protected void doHealthCheck(Health.Builder builder) throws Exception {
        // 检查数据库连接
        boolean dbHealthy = databaseService.isConnected();
        // 检查缓存状态
        boolean cacheHealthy = cacheService.isAvailable();

        if (dbHealthy && cacheHealthy) {
            builder.up()
                   .withDetail("database", "connected")
                   .withDetail("cache", "available")
                   .withDetail("timestamp", Instant.now());
        } else {
            builder.down()
                   .withDetail("database", dbHealthy ? "connected" : "disconnected")
                   .withDetail("cache", cacheHealthy ? "available" : "unavailable")
                   .withException(new RuntimeException("Service degradation"));
        }
    }
}
3.2 指标收集与暴露
自定义业务指标:
@Service
public class OrderService {

    private final MeterRegistry meterRegistry;
    private final Timer orderProcessingTimer;
    private final Counter failedOrderCounter;
    private final DistributionSummary orderAmountSummary;

    public OrderService(MeterRegistry meterRegistry) {
        this.meterRegistry = meterRegistry;
        this.orderProcessingTimer = Timer.builder("order.processing.time")
                .description("订单处理时间")
                .tags("service", "order")
                .register(meterRegistry);

        this.failedOrderCounter = Counter.builder("order.failed.count")
                .description("失败订单数量")
                .tags("service", "order")
                .register(meterRegistry);

        this.orderAmountSummary = DistributionSummary.builder("order.amount.summary")
                .description("订单金额分布")
                .baseUnit("USD")
                .register(meterRegistry);
    }

    @Transactional
    public Order processOrder(OrderRequest request) {
        return orderProcessingTimer.record(() -> {
            try {
                // 业务处理逻辑
                validateOrder(request);
                Order order = createOrder(request);
                processPayment(order);

                // 记录订单金额
                orderAmountSummary.record(order.getAmount().doubleValue());

                return order;
            } catch (Exception e) {
                // 记录失败指标
                failedOrderCounter.increment();
                throw new OrderProcessingException("订单处理失败", e);
            }
        });
    }

    // 方法级别的监控
    @Timed(value = "order.validation.time", description = "订单验证时间")
    private void validateOrder(OrderRequest request) {
        // 验证逻辑
    }

    @Timed(value = "order.creation.time", description = "订单创建时间")
    private Order createOrder(OrderRequest request) {
        // 创建逻辑
        return new Order();
    }
}
3.3 分布式追踪集成
集成Micrometer Tracing:
management:
  tracing:
    sampling:
      probability: 1.0
  zipkin:
    base-url: http://localhost:9411
@Configuration
public class TracingConfig {

    @Bean
    public ObservationHandler<Observation.Context> customObservationHandler() {
        return new ObservationHandler<>() {
            @Override
            public boolean supportsContext(Observation.Context context) {
                return true;
            }

            @Override
            public void onStart(Observation.Context context) {
                context.put("startTime", System.currentTimeMillis());
                log.info("Starting observation: {}", context.getName());
            }

            @Override
            public void onStop(Observation.Context context) {
                long duration = System.currentTimeMillis() - (Long) context.get("startTime");
                log.info("Completed observation: {} in {}ms", context.getName(), duration);
            }
        };
    }
}
4. 性能优化实战技巧
4.1 数据库性能优化
JPA/Hibernate优化:
@Configuration
public class JpaOptimizationConfig {

    @Bean
    public LocalContainerEntityManagerFactoryBean entityManagerFactory(DataSource dataSource) {
        LocalContainerEntityManagerFactoryBean em = new LocalContainerEntityManagerFactoryBean();
        em.setDataSource(dataSource);
        em.setPackagesToScan("com.example.entity");

        JpaVendorAdapter vendorAdapter = new HibernateJpaVendorAdapter();
        em.setJpaVendorAdapter(vendorAdapter);

        Properties properties = new Properties();
        properties.setProperty("hibernate.hbm2ddl.auto", "validate");
        properties.setProperty("hibernate.dialect", "org.hibernate.dialect.MySQL8Dialect");
        properties.setProperty("hibernate.show_sql", "false");
        properties.setProperty("hibernate.format_sql", "true");
        properties.setProperty("hibernate.use_sql_comments", "true");
        properties.setProperty("hibernate.jdbc.batch_size", "50");
        properties.setProperty("hibernate.order_inserts", "true");
        properties.setProperty("hibernate.order_updates", "true");
        properties.setProperty("hibernate.jdbc.fetch_size", "100");
        properties.setProperty("hibernate.default_batch_fetch_size", "16");
        properties.setProperty("hibernate.cache.use_second_level_cache", "true");
        properties.setProperty("hibernate.cache.use_query_cache", "true");
        properties.setProperty("hibernate.cache.region.factory_class",
            "org.hibernate.cache.ehcache.EhCacheRegionFactory");

        em.setJpaProperties(properties);
        return em;
    }
}
查询优化示例:
@Repository
@Slf4j
public class OptimizedUserRepository {

    @PersistenceContext
    private EntityManager entityManager;

    // 使用DTO投影减少数据传输
    public List<UserDTO> findActiveUsersWithProjection() {
        return entityManager.createQuery(
                "SELECT new com.example.dto.UserDTO(u.id, u.username, u.email) " +
                "FROM User u WHERE u.active = true", UserDTO.class)
                .setHint("org.hibernate.readOnly", true)
                .getResultList();
    }

    // 批量处理优化
    @Transactional
    public void batchInsertUsers(List<User> users) {
        for (int i = 0; i < users.size(); i++) {
            entityManager.persist(users.get(i));
            if (i % 50 == 0) { // 每50条刷新一次
                entityManager.flush();
                entityManager.clear();
            }
        }
    }

    // 使用EntityGraph解决N+1问题
    public List<User> findUsersWithOrders() {
        EntityGraph<User> graph = entityManager.createEntityGraph(User.class);
        graph.addSubgraph("orders");

        return entityManager.createQuery("SELECT u FROM User u", User.class)
                .setHint("javax.persistence.fetchgraph", graph)
                .getResultList();
    }
}
4.2 缓存优化策略
多级缓存配置:
@Configuration
@EnableCaching
public class CacheConfig {

    @Bean
    public CacheManager cacheManager() {
        CaffeineCacheManager cacheManager = new CaffeineCacheManager();
        cacheManager.setCaffeine(caffeineCacheBuilder());
        cacheManager.setCacheNames(Arrays.asList("users", "products", "orders"));
        return cacheManager;
    }

    Caffeine<Object, Object> caffeineCacheBuilder() {
        return Caffeine.newBuilder()
                .initialCapacity(100)
                .maximumSize(500)
                .expireAfterAccess(10, TimeUnit.MINUTES)
                .recordStats();
    }

    @Bean
    public RedisCacheManager redisCacheManager(RedisConnectionFactory redisConnectionFactory) {
        RedisCacheConfiguration config = RedisCacheConfiguration.defaultCacheConfig()
                .entryTtl(Duration.ofHours(1))
                .serializeKeysWith(RedisSerializationContext.SerializationPair
                        .fromSerializer(new StringRedisSerializer()))
                .serializeValuesWith(RedisSerializationContext.SerializationPair
                        .fromSerializer(new GenericJackson2JsonRedisSerializer()));

        return RedisCacheManager.builder(redisConnectionFactory)
                .cacheDefaults(config)
                .transactionAware()
                .build();
    }
}
缓存使用最佳实践:
@Service
@Slf4j
public class CachedUserService {

    private final UserRepository userRepository;

    public CachedUserService(UserRepository userRepository) {
        this.userRepository = userRepository;
    }

    @Cacheable(value = "users", key = "#id", unless = "#result == null")
    public User getUserById(Long id) {
        log.info("Fetching user from database: {}", id);
        return userRepository.findById(id).orElse(null);
    }

    @CacheEvict(value = "users", key = "#user.id")
    public User updateUser(User user) {
        return userRepository.save(user);
    }

    @Caching(evict = {
        @CacheEvict(value = "users", key = "#id"),
        @CacheEvict(value = "userLists", allEntries = true)
    })
    public void deleteUser(Long id) {
        userRepository.deleteById(id);
    }

    @Cacheable(value = "userLists", keyGenerator = "customKeyGenerator")
    public List<User> getActiveUsers() {
        return userRepository.findByActiveTrue();
    }
}
4.3 线程池与异步处理优化
线程池精细化配置:
@Configuration
@EnableAsync
public class AsyncConfig implements AsyncConfigurer {

    @Override
    public Executor getAsyncExecutor() {
        ThreadPoolTaskExecutor executor = new ThreadPoolTaskExecutor();
        executor.setCorePoolSize(10);
        executor.setMaxPoolSize(50);
        executor.setQueueCapacity(100);
        executor.setThreadNamePrefix("async-");
        executor.setRejectedExecutionHandler(new ThreadPoolExecutor.CallerRunsPolicy());
        executor.setWaitForTasksToCompleteOnShutdown(true);
        executor.setAwaitTerminationSeconds(60);
        executor.initialize();
        return executor;
    }

    @Bean("ioExecutor")
    public Executor ioIntensiveExecutor() {
        ThreadPoolTaskExecutor executor = new ThreadPoolTaskExecutor();
        executor.setCorePoolSize(20);
        executor.setMaxPoolSize(100);
        executor.setQueueCapacity(200);
        executor.setThreadNamePrefix("io-");
        executor.initialize();
        return executor;
    }

    @Bean("cpuExecutor")
    public Executor cpuIntensiveExecutor() {
        ThreadPoolTaskExecutor executor = new ThreadPoolTaskExecutor();
        executor.setCorePoolSize(Runtime.getRuntime().availableProcessors());
        executor.setMaxPoolSize(Runtime.getRuntime().availableProcessors() * 2);
        executor.setThreadNamePrefix("cpu-");
        executor.initialize();
        return executor;
    }
}
异步处理示例:
@Service
@Slf4j
public class AsyncProcessingService {

    @Async("ioExecutor")
    public CompletableFuture<String> processImageAsync(String imagePath) {
        return CompletableFuture.supplyAsync(() -> {
            try {
                // 模拟耗时IO操作
                Thread.sleep(1000);
                return "Processed: " + imagePath;
            } catch (InterruptedException e) {
                Thread.currentThread().interrupt();
                throw new RuntimeException("Processing interrupted", e);
            }
        });
    }

    @Async("cpuExecutor")
    public CompletableFuture<BigDecimal> calculateAsync(BigDecimal input) {
        return CompletableFuture.supplyAsync(() -> {
            // CPU密集型计算
            BigDecimal result = input;
            for (int i = 0; i < 1000; i++) {
                result = result.multiply(BigDecimal.valueOf(1.01));
            }
            return result;
        });
    }

    @Async
    @Timed(value = "async.operation.time", description = "异步操作时间")
    public void asyncOperationWithMonitoring() {
        // 带有监控的异步操作
    }
}
5. 高级监控与诊断
5.1 APM集成(Application Performance Monitoring)
集成New Relic或AppDynamics:
# application.yml
newrelic:
  config:
    app_name: ${spring.application.name}
    license_key: ${NEW_RELIC_LICENSE_KEY}
自定义APM指标:
@Component
public class CustomAPMAgent {

    private final MeterRegistry meterRegistry;
    private final NewRelic newRelic;

    public CustomAPMAgent(MeterRegistry meterRegistry, NewRelic newRelic) {
        this.meterRegistry = meterRegistry;
        this.newRelic = newRelic;
    }

    public void recordBusinessTransaction(String name, long duration) {
        // Micrometer记录
        Timer.builder("business.transaction")
                .tags("name", name)
                .register(meterRegistry)
                .record(duration, TimeUnit.MILLISECONDS);

        // New Relic记录
        newRelic.recordMetric("Custom/BusinessTransaction/" + name, duration);
    }
}
5.2 内存分析与GC调优
JVM参数优化:
# 启动参数示例
java -jar application.jar \
-Xms2g -Xmx2g \
-XX:+UseG1GC \
-XX:MaxGCPauseMillis=200 \
-XX:InitiatingHeapOccupancyPercent=35 \
-XX:+ExplicitGCInvokesConcurrent \
-XX:+PrintGC \
-XX:+PrintGCDetails \
-XX:+PrintGCTimeStamps \
-XX:+PrintGCDateStamps \
-XX:+PrintGCApplicationStoppedTime \
-Xloggc:gc.log \
-XX:+UseStringDeduplication \
-XX:+HeapDumpOnOutOfMemoryError \
-XX:HeapDumpPath=./heapdump.hprof
内存监控端点:
@RestController
@RequestMapping("/api/diagnostics")
public class DiagnosticsController {

    @GetMapping("/memory")
    public Map<String, Object> memoryInfo() {
        MemoryMXBean memoryMXBean = ManagementFactory.getMemoryMXBean();
        Runtime runtime = Runtime.getRuntime();

        Map<String, Object> info = new HashMap<>();
        info.put("heapUsed", memoryMXBean.getHeapMemoryUsage().getUsed());
        info.put("heapMax", memoryMXBean.getHeapMemoryUsage().getMax());
        info.put("nonHeapUsed", memoryMXBean.getNonHeapMemoryUsage().getUsed());
        info.put("totalMemory", runtime.totalMemory());
        info.put("freeMemory", runtime.freeMemory());
        info.put("memoryUsage", (runtime.totalMemory() - runtime.freeMemory()) * 100 / runtime.totalMemory());

        return info;
    }

    @GetMapping("/gc")
    public List<Map<String, Object>> gcInfo() {
        List<GarbageCollectorMXBean> gcBeans = ManagementFactory.getGarbageCollectorMXBeans();
        return gcBeans.stream().map(bean -> {
            Map<String, Object> gcInfo = new HashMap<>();
            gcInfo.put("name", bean.getName());
            gcInfo.put("collectionCount", bean.getCollectionCount());
            gcInfo.put("collectionTime", bean.getCollectionTime());
            return gcInfo;
        }).collect(Collectors.toList());
    }
}
6. 性能测试与基准评估
6.1 JMH基准测试
集成JMH进行微基准测试:
<dependency>
    <groupId>org.openjdk.jmh</groupId>
    <artifactId>jmh-core</artifactId>
    <version>1.35</version>
    <scope>test</scope>
</dependency>
<dependency>
    <groupId>org.openjdk.jmh</groupId>
    <artifactId>jmh-generator-annprocess</artifactId>
    <version>1.35</version>
    <scope>test</scope>
</dependency>
基准测试示例:
@BenchmarkMode(Mode.AverageTime)
@OutputTimeUnit(TimeUnit.MICROSECONDS)
@State(Scope.Benchmark)
@Warmup(iterations = 3, time = 1)
@Measurement(iterations = 5, time = 1)
@Fork(2)
public class ServiceBenchmark {

    private UserService userService;
    private OrderService orderService;

    @Setup
    public void setup() {
        // 初始化测试环境
        userService = new UserService();
        orderService = new OrderService();
    }

    @Benchmark
    public User benchmarkUserCreation() {
        return userService.createUser("test@example.com");
    }

    @Benchmark
    public Order benchmarkOrderProcessing() {
        return orderService.processOrder(createTestOrder());
    }

    private OrderRequest createTestOrder() {
        return new OrderRequest("test@example.com", BigDecimal.valueOf(100.0));
    }
}
6.2 负载测试与压力测试
使用Gatling进行负载测试:
import io.gatling.core.Predef._
import io.gatling.http.Predef._
import scala.concurrent.duration._
class LoadTest extends Simulation {

  val httpProtocol = http
    .baseUrl("http://localhost:8080")
    .acceptHeader("application/json")

  val scn = scenario("User Load Test")
    .exec(
      http("Create User")
        .post("/api/users")
        .body(StringBody("""{"email": "test${randomInt()}@example.com", "name": "Test User"}"""))
        .asJson
        .check(status.is(201))
    )
    .pause(1)
    .exec(
      http("Get Users")
        .get("/api/users")
        .check(status.is(200))
    )

  setUp(
    scn.inject(
      rampUsersPerSec(10).to(100).during(1.minute),
      constantUsersPerSec(100).during(5.minutes)
    ).protocols(httpProtocol)
  )
}
7. 常见性能问题与解决方案
7.1 内存泄漏诊断
内存泄漏检测模式:
@Component
public class MemoryLeakDetector {

    private final Map<String, byte[]> memoryMap = new HashMap<>();
    private final ScheduledExecutorService scheduler = Executors.newScheduledThreadPool(1);

    @PostConstruct
    public void startMonitoring() {
        scheduler.scheduleAtFixedRate(this::checkMemoryUsage, 1, 1, TimeUnit.MINUTES);
    }

    private void checkMemoryUsage() {
        MemoryUsage heapUsage = ManagementFactory.getMemoryMXBean().getHeapMemoryUsage();
        long usedMemory = heapUsage.getUsed();
        long maxMemory = heapUsage.getMax();

        double usagePercentage = (double) usedMemory / maxMemory * 100;

        if (usagePercentage > 80) {
            log.warn("内存使用率过高: {}%", String.format("%.2f", usagePercentage));
            // 触发内存分析或报警
            analyzeMemoryUsage();
        }
    }

    private void analyzeMemoryUsage() {
        // 生成堆转储或执行内存分析
        try {
            String timestamp = LocalDateTime.now().format(DateTimeFormatter.ISO_LOCAL_DATE_TIME);
            String dumpFile = "heapdump-" + timestamp + ".hprof";
            HotSpotDiagnosticMXBean diagnosticMXBean = ManagementFactory
                .getPlatformMXBean(HotSpotDiagnosticMXBean.class);
            diagnosticMXBean.dumpHeap(dumpFile, true);
            log.info("堆转储已生成: {}", dumpFile);
        } catch (IOException e) {
            log.error("生成堆转储失败", e);
        }
    }

    @PreDestroy
    public void cleanup() {
        scheduler.shutdown();
        memoryMap.clear();
    }
}
7.2 数据库连接池优化
HikariCP优化配置:
spring:
  datasource:
    hikari:
      pool-name: MainPool
      maximum-pool-size: 20
      minimum-idle: 5
      idle-timeout: 30000
      connection-timeout: 20000
      max-lifetime: 1800000
      leak-detection-threshold: 5000
      connection-test-query: SELECT 1
连接池监控:
@Component
@Slf4j
public class ConnectionPoolMonitor {

    private final HikariDataSource dataSource;
    private final MeterRegistry meterRegistry;

    public ConnectionPoolMonitor(HikariDataSource dataSource, MeterRegistry meterRegistry) {
        this.dataSource = dataSource;
        this.meterRegistry = meterRegistry;
    }

    @Scheduled(fixedRate = 30000)
    public void monitorConnectionPool() {
        HikariPoolMXBean poolMXBean = dataSource.getHikariPoolMXBean();

        Gauge.builder("db.pool.active.connections", poolMXBean, HikariPoolMXBean::getActiveConnections)
                .register(meterRegistry);
        Gauge.builder("db.pool.idle.connections", poolMXBean, HikariPoolMXBean::getIdleConnections)
                .register(meterRegistry);
        Gauge.builder("db.pool.total.connections", poolMXBean, HikariPoolMXBean::getTotalConnections)
                .register(meterRegistry);
        Gauge.builder("db.pool.threads.awaiting", poolMXBean, HikariPoolMXBean::getThreadsAwaitingConnection)
                .register(meterRegistry);

        if (poolMXBean.getThreadsAwaitingConnection() > 10) {
            log.warn("数据库连接池压力过大,等待线程: {}", poolMXBean.getThreadsAwaitingConnection());
        }
    }
}
8. 总结:性能优化最佳实践
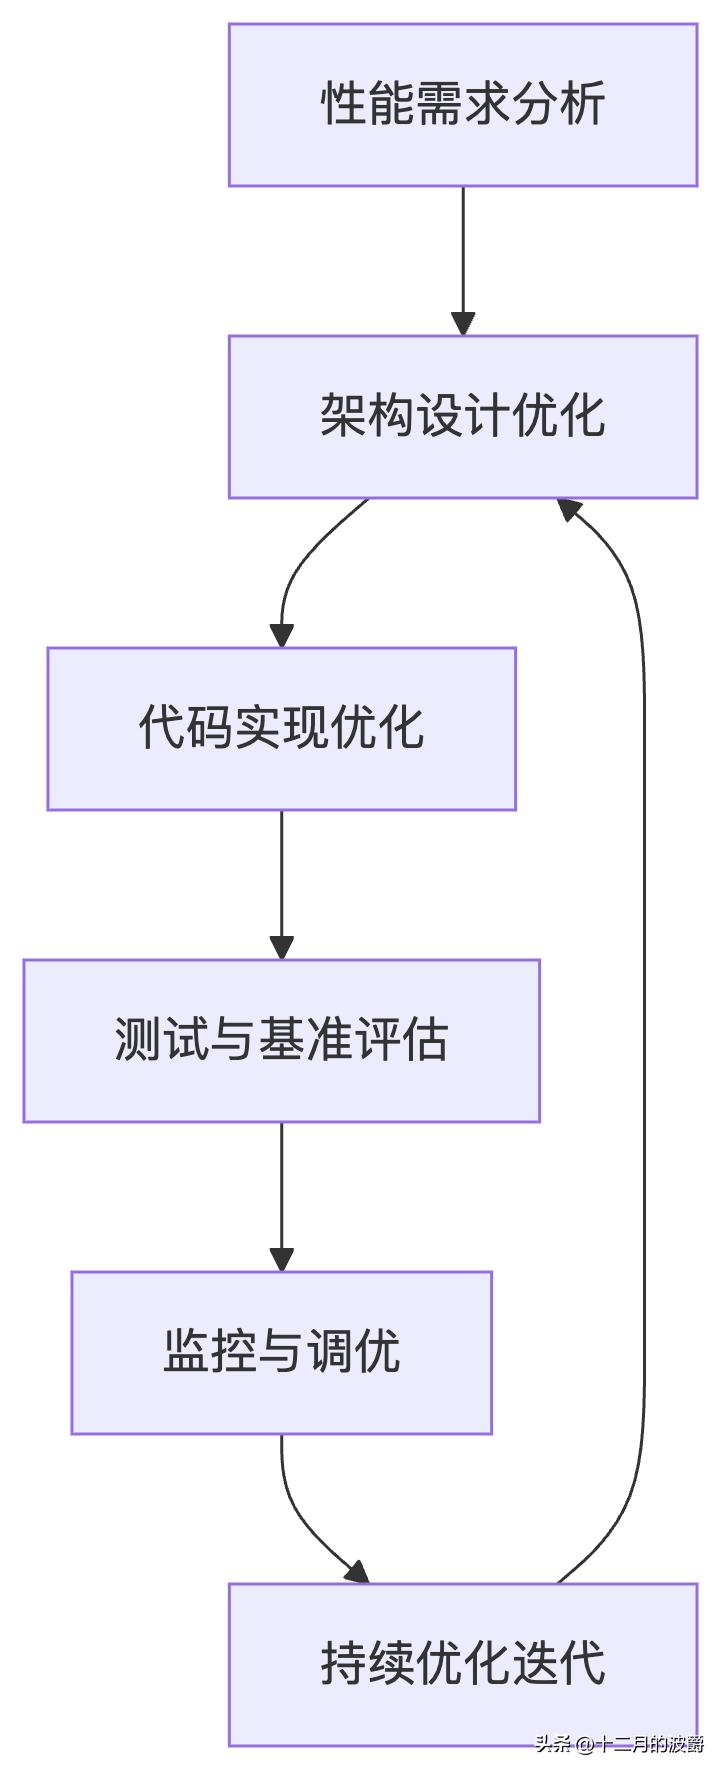
8.1 性能优化生命周期
8.2 优化策略总结
- 监控先行:没有监控就没有优化,建立完善的监控体系
- 数据驱动:基于实际数据做出优化决策,避免盲目优化
- 分层优化:从架构、代码、数据库、JVM等多个层面系统优化
- 迭代改进:性能优化是一个持续的过程,不是一次性的任务
- 平衡取舍:在性能、可维护性、开发成本之间找到平衡点
8.3 持续性能文化
记住:性能优化不是项目最后阶段的补救措施,而应该是贯穿整个开发周期的持续实践。建立性能文化,让每个开发者都成为性能专家:
编写性能友好的代码
定期进行性能评审
建立性能基准和SLA
自动化性能测试
持续监控和优化
通过系统性地应用Spring性能监控和优化技术,你将能够构建出高性能、高可用的企业级应用,为用户提供卓越的使用体验。


 1749
1749

 被折叠的 条评论
为什么被折叠?
被折叠的 条评论
为什么被折叠?
 到【灌水乐园】发言


