


CODE
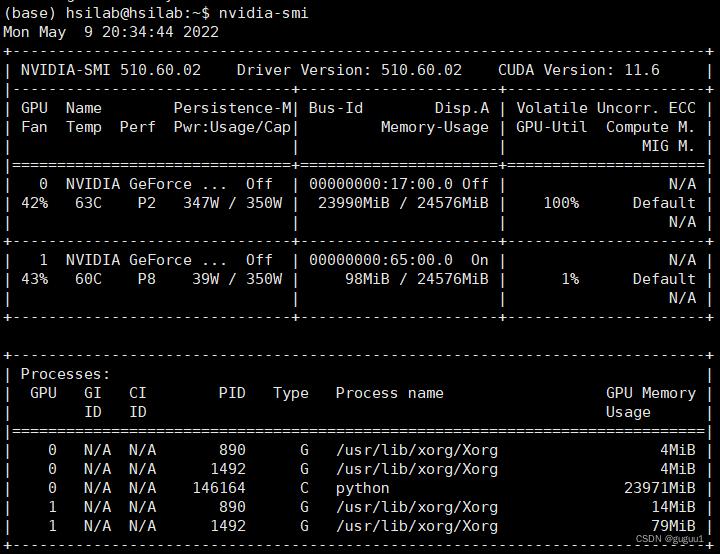
使用第几张显卡
通过nvidia -smi查看显卡号
# device setup
use_cuda = torch.cuda.is_available()
device = torch.device('cuda:1' if use_cuda else 'cpu')
# 使用第一张显卡
#device = torch.device('cuda' if use_cuda else 'cpu')
使用plt画图
fig = plt.figure(figsize=(8, 8), dpi=100) # 显示框设置,dpi为图片分辨率
plt.imshow(vis_img) # 保存图片,类似于print()
fig.savefig(os.path.join(save_dir, class_name + '_{}'.format(i)), dpi=100)
使用plt画图,去掉图片四周的白边
mport matplotlib.pyplot as plt

fig, ax = plt.subplots()
im = im[:, :, (2, 1, 0)]
ax.imshow(im, aspect='equal')
plt.xticks([])  # 去掉x轴
plt.yticks([])  # 去掉y轴
plt.axis('off')  # 去掉坐标轴
# 去除图像周围的白边
height, width, channels = im.shape
# 如果dpi=300,那么图像大小=height*width
fig.set_size_inches(width/100.0/3.0, height/100.0/3.0)
plt.gca().xaxis.set_major_locator(plt.NullLocator())
plt.gca().yaxis.set_major_locator(plt.NullLocator())
plt.subplots_adjust(top=1,bottom=0,left=0,right=1,hspace=0,wspace=0)
plt.margins(0,0)

#dpi是设置清晰度的,大于300就很清晰了,但是保存下来的图片很大
plt.savefig(‘result.png’, dpi=300)
‘_{}’.format(i)的含义
字符串的格式化,字符串中有一些可以被替换掉的占位符,而格式化的过程就是对这些占位符替换的过程,举例来说:“I am a {}”.format(“student”)
它表示将字符串"I am a {}“进行格式化,格式化的结果就是该字符串中的占位符{}被format()函数中的参数替换,就本例来说就是用"student"替换掉{},最终得到:“I am a student”
*.如果字符串中有多个占位符,且占位符中没有数字,则替换的时候使用format()中的变量从左到右依次对占位符{}进行替换,如:a = “how”;b = “are”;c = “you”
则 “{} {} {}”.format(a,b,c)执行后的结果就是:“how are you”
*.如果字符串中有多个占位符,且占位符中标有数字,则替换的时候占位符要用format()中相应位置的变量进行替换,如a = “how”;b = “are”;c = “you”
“{2} {0} {1}”.foramt(a,b,c)执行后的结果是:“you how are”
参考链接
plt中imshow()与show()的区别
plt.imshow()函数负责对图像进行处理,并显示其格式。
plt.show()则是将plt.imshow()处理后的函数显示出来。
参考链接
数组怎么转化为字符串
# str为字符串,arr为数组
str = ''.join(str(i) for i in arr)
cv2.putText()用法
# 各参数依次是:照片/添加的文字/左上角坐标/字体/字体大小/颜色/字体粗细
cv2.putText(I,'there 0 error(s):',(50,150),cv2.FONT_HERSHEY_COMPLEX,6,(0,0,255),25)
1
cv2.findContours()函数
cv2.findContours(image, mode, method[, contours[, hierarchy[, offset ]]])
返回两个值:contours(轮廓本身)、hierarchy(每条轮廓对应的属性)
参考链接1
参考链接2
OpenCV如何将不同轮廓合并成一个轮廓
import numpy as np
import cv2

src = cv2.imread('A.jpg')
cv2.imshow('src', src)

split_res = src.copy()#显示每个轮廓结构
merge_res = src.copy()#显示合并后轮廓结构

# 记录开始时间
start = cv2.getTickCount()
hsvImg = cv2.cvtColor(src,cv2.COLOR_BGR2HSV)
H,S,V = cv2.split(hsvImg)
ret, thresImg= cv2.threshold(S, 138, 255, cv2.THRESH_BINARY)
cv2.imshow('threshold', thresImg)
blurImg = cv2.medianBlur(thresImg,5)
cv2.imshow('blur', blurImg)

contours,hierarchy = cv2.findContours(blurImg, cv2.RETR_EXTERNAL, cv2.CHAIN_APPROX_NONE)

merge_list = []
for cnt in contours:
  rect = cv2.minAreaRect(cnt)

  box = cv2.boxPoints(rect)
  box = np.int0(box)
  split_res = cv2.drawContours(split_res,[box],0,(0,0,255),2)
  merge_list.append(cnt)
cv2.imshow('split_res', split_res)
cv2.imwrite('split_res.jpg', split_res)

contours_merge = np.vstack([merge_list[0],merge_list[1]])
for i in range(2, len(merge_list)):
  contours_merge = np.vstack([contours_merge,merge_list[i]])

rect2 = cv2.minAreaRect(contours_merge)
box2 = cv2.boxPoints(rect2)
box2 = np.int0(box2)
merge_res = cv2.drawContours(merge_res,[box2],0,(0,255,0),2)
cv2.imshow('merge_res', merge_res)
cv2.imwrite('merge_res.jpg', merge_res)

# 记录结束时间
end = cv2.getTickCount()
# 运行耗时
use_time = (end - start) / cv2.getTickFrequency()
print('use-time: %.3fs' % use_time)

cv2.waitKey(0)
cv2.destroyAllWindows()
print ('finish')
cv2 读取、显示、保存图片
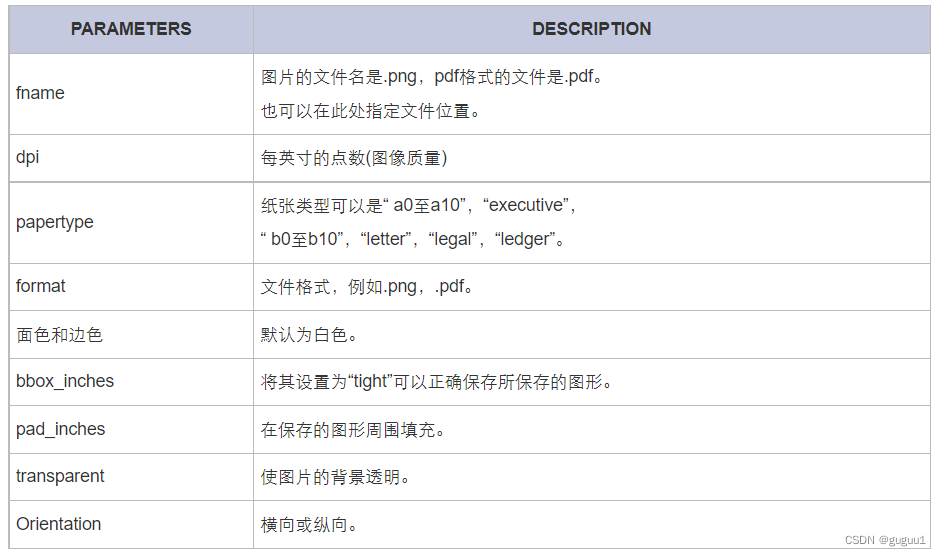
pyplot.savefig()
save_image(fake_images, './img/fake_images-{}.png'.format(epoch + 1))
matplotlib.pyplot.subplots_adjust
subplots_adjust(left=None, bottom=None, right=None, top=None, wspace=None, hspace=None)


 1660
1660

 被折叠的 条评论
为什么被折叠?
被折叠的 条评论
为什么被折叠?
 到【灌水乐园】发言


