


 本文介绍了一种使用Python对基金净值数据进行按年月分组统计的方法。通过pandas库读取CSV文件中的数据,并利用groupby函数按年月进行分组,计算每组的最大值、最小值和平均值。最后通过matplotlib绘制基金净值的变化趋势图。
按年月分组统计:基金净值
groupby_ym.py
# coding=utf-8
import os, sys
import matplotlib.pyplot as plt
import pandas as pd
# python 按年月分组统计:基金净值
if len(sys.argv) ==2:
fcode = sys.argv[1]
else:
print('usage: python groupby_ym.py fcode ')
sys.exit(1)
if len(fcode) !=6:
print(' fcode is char(6)')
sys.exit(2)
file1 = "./" +fcode +'.csv'
if not os.path.exists(file1):
print(file1 +' is not exists.')
sys.exit(3)
# 用pandas读取csv
df = pd.read_csv(file1)
del df['ljjz'] # 删除多余一列数据
df = df[ df['date'] > '2019-01-01']
df.index = pd.to_datetime(df.date)
ym_max = df.groupby([df.index.year, df.index.month]).apply(lambda t: t[t.jz==t.jz.max()])
print('ym_max:',ym_max)
ym_min = df.groupby([df.index.year, df.index.month]).apply(lambda t: t[t.jz==t.jz.min()])
print('ym_min:',ym_min)
ym_mean = df.groupby([df.index.year, df.index.month]).mean()
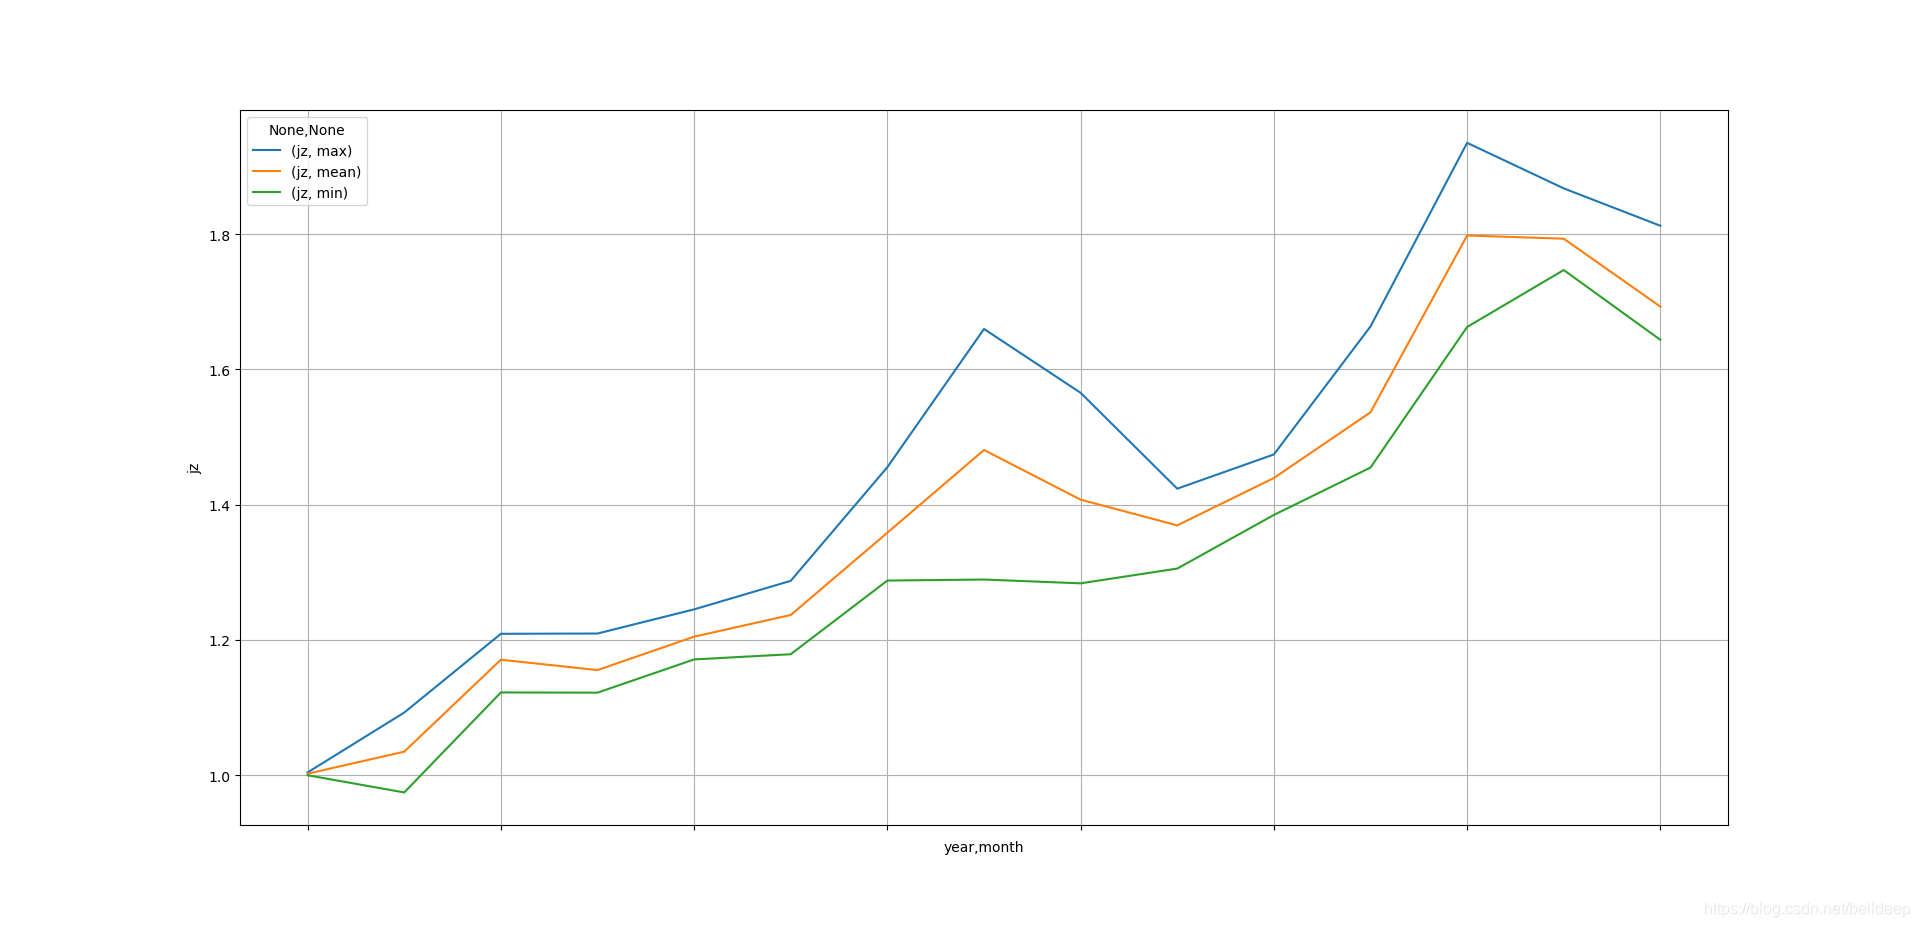
ym_agg = df.groupby([df.index.year, df.index.month]).agg({'jz':['max','mean','min']})
#print('ym_agg:',ym_agg)
ym_agg.plot()
plt.xlabel('year,month')
plt.ylabel('jz')
plt.grid()
plt.show()
运行 python groupby_ym.py 515000


 1698
1698

 被折叠的 条评论
为什么被折叠?
被折叠的 条评论
为什么被折叠?
 到【灌水乐园】发言


