


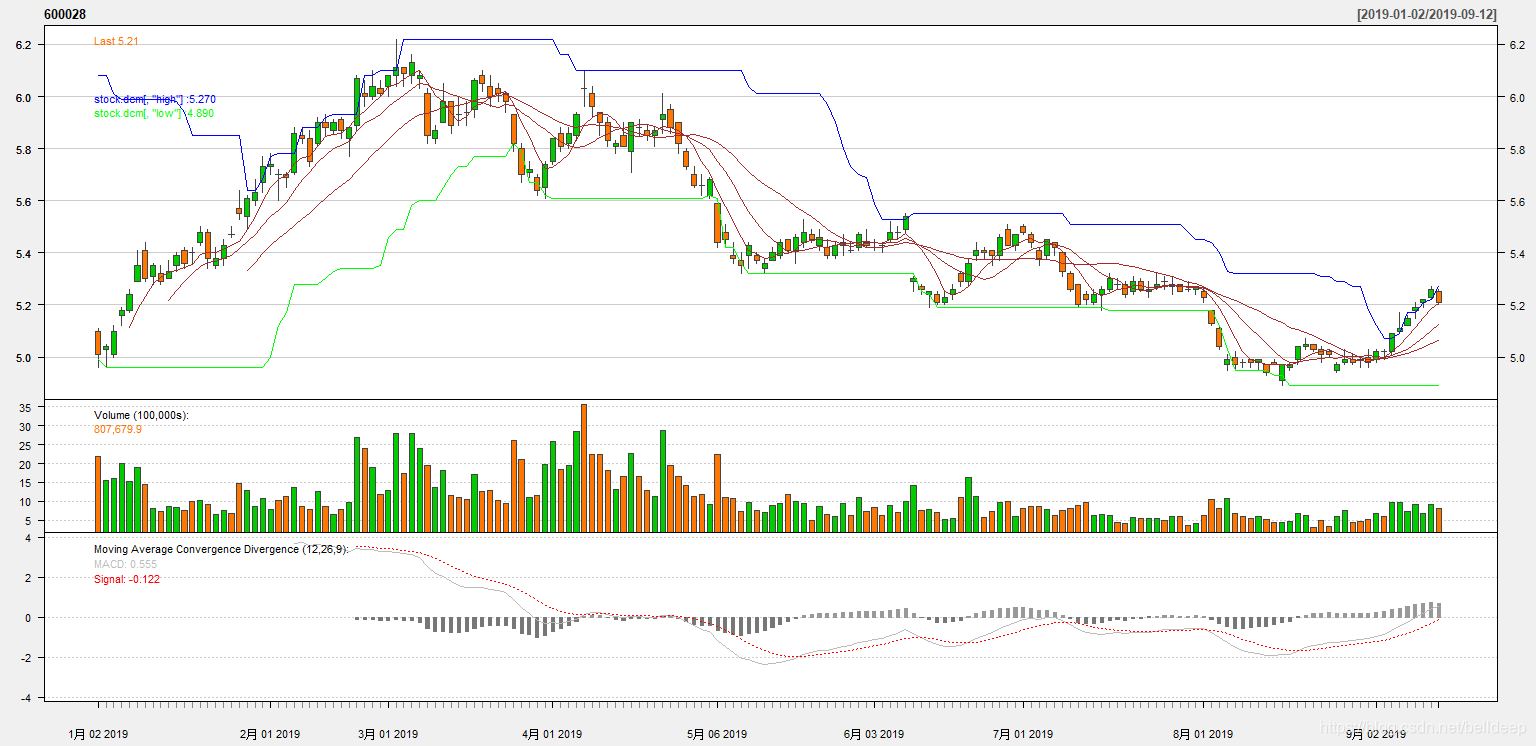
 本文介绍如何利用R语言及其quantmod包读取并分析股票数据,包括唐奇安通道指标的计算与图表展示,以及均线、MACD等技术指标的应用。
# http://www.quantmod.com/
kline2.R
#install.packages("quantmod")
library(TTR)
library(zoo)
library(xts)
library(quantmod)
#help(DonchianChannel) # 唐奇安通道

setwd("D:/stock/")
code = "600028"
txt <- paste(code,"txt",sep='.')
df <- read.csv(txt, header=T, sep=',')
myvars <- c("open","high","low","close","volume")
data <- xts(df[myvars], order.by=as.Date(as.character(df[,1]),format="%Y-%m-%d"))
#head(data)
#tail(data)
stock <- as.xts(data, descr=code)
stock.dcm <- DonchianChannel(stock[,c("high","low")], n=20, include.lag= TRUE)
chartSeries(x=stock["2019"], name=code, line.type="l", bar.type="ohcl", theme="white",
	TA="addVo();addSMA(5);addSMA(10);addSMA(20);addMACD();")
addTA(stock.dcm[, "high"], type="l", on=1, col="blue")
addTA(stock.dcm[, "low"], type="l", on=1, col="green")
#addTA(stock.dcm[, "mid"], type="l", on=1, col="yellow")


 761
761


 到【灌水乐园】发言


