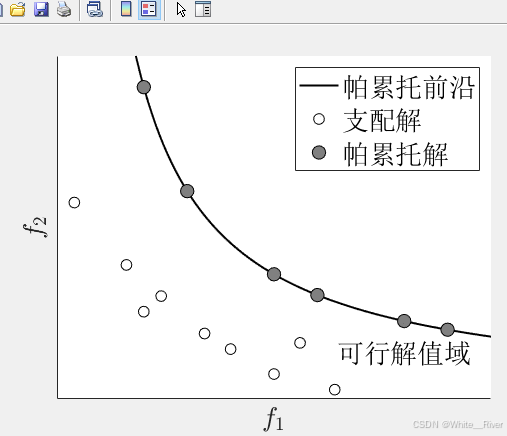
% MATLAB script to plot a hyperbolic Pareto front and dominated solutions% Define the range of f1
f1 =linspace(0.5,5,100);% Define the hyperbolic curve (Pareto front)
f2 =10./ f1;% Select 6 points on the Pareto front (non-dominated solutions)
pareto_f1 =[1,1.5,2.5,3,4,4.5];
pareto_f2 =10./ pareto_f1;% Randomly generate 10 points below the Pareto front (dominated solutions)
dominated_f1 =[1.2,2,2.7,3.5,4.2,1.8,3.8,4.8,2.2,3]-1;
dominated_f2 =[8,4.5,3.8,2.5,2,6,3.5,1.5,5,3.3]-1.7;% Plotting
figure;
hold on;% Plot the Pareto front (hyperbolic curve)plot(f1, f2,'k-','LineWidth',1.5);% Plot dominated solutionsplot(dominated_f1, dominated_f2,'o','MarkerSize',8,'MarkerFaceColor','w','MarkerEdgeColor','k');% Plot Pareto solutionsplot(pareto_f1, pareto_f2,'o','MarkerSize',10,'MarkerFaceColor',[0.5,0.5,0.5],'MarkerEdgeColor','k');% Labeling the plotxlabel('$f_1$','Interpreter','latex','FontSize',20);ylabel('$f_2$','Interpreter','latex','FontSize',20);%title('支配解 vs 帕累托解', 'FontSize', 20);% Adding the legend (in Chinese)legend('帕累托前沿','支配解','帕累托解','Location','northeast','FontSize',20);% Set axis limits (adjust as necessary)xlim([05]);ylim([011]);% Remove axis ticks and numbersset(gca,'XTick',[],'YTick',[]);% Add the text "可行解空间" below the Pareto fronttext(4,1.5,'可行解值域','FontSize',20,'HorizontalAlignment','center');% Hold off to stop plotting
hold off;


 1476
1476

 被折叠的 条评论
为什么被折叠?
被折叠的 条评论
为什么被折叠?
 到【灌水乐园】发言


