


1、设置折线图样式(修改后)(背景竖条纹间隔,去掉边框,设置折线和节点颜色,设置数据字体颜色)
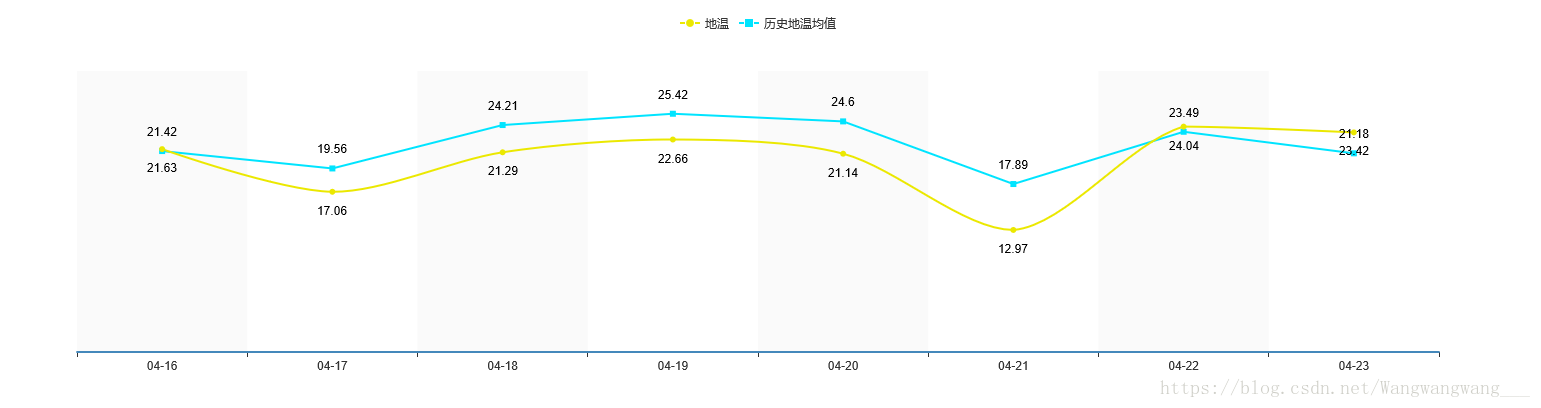
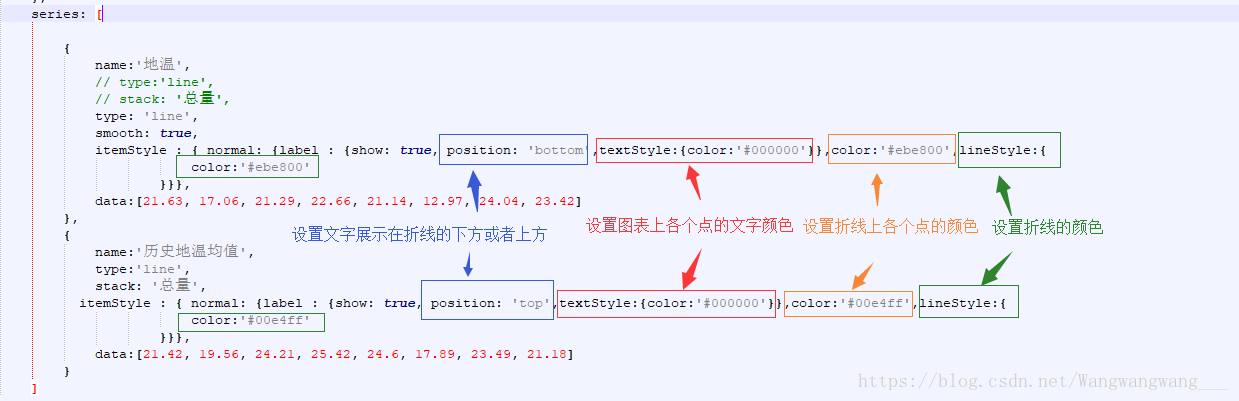
设置折线样式:
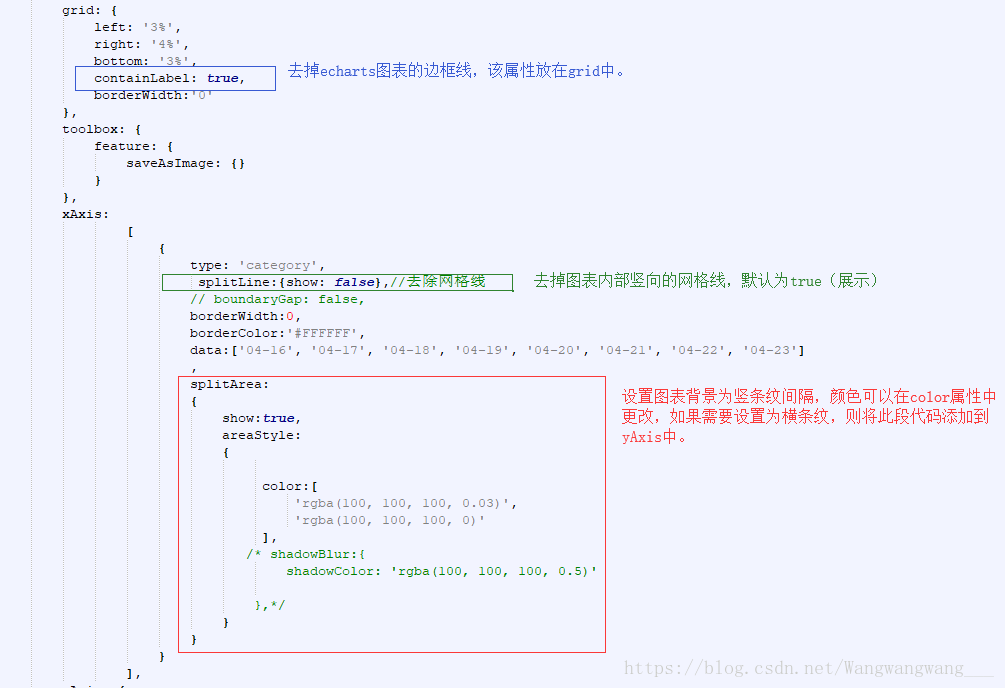
设置折线图的背景样式:
2.设置柱状图样式(修改后)
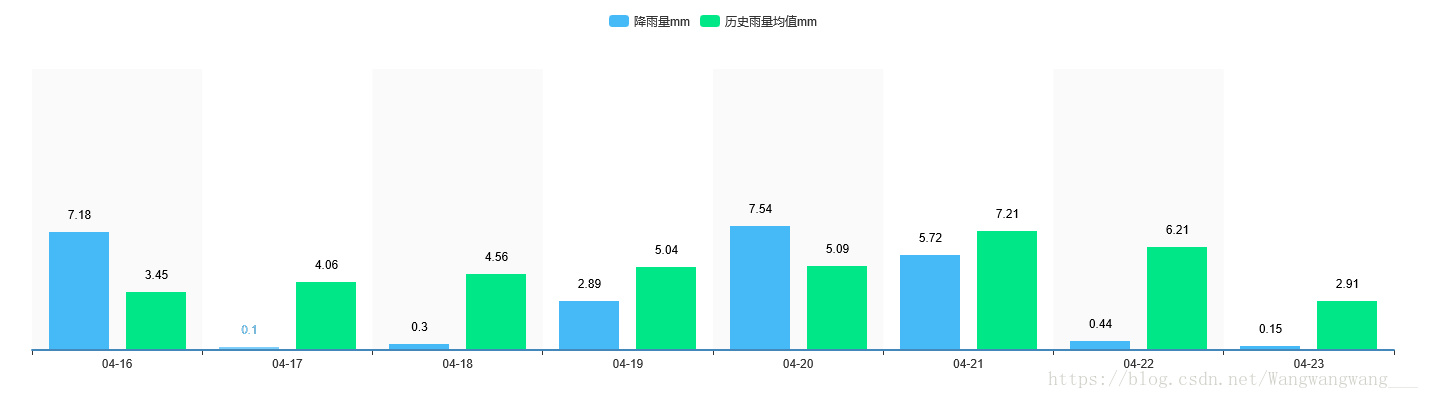
设置柱子的样式
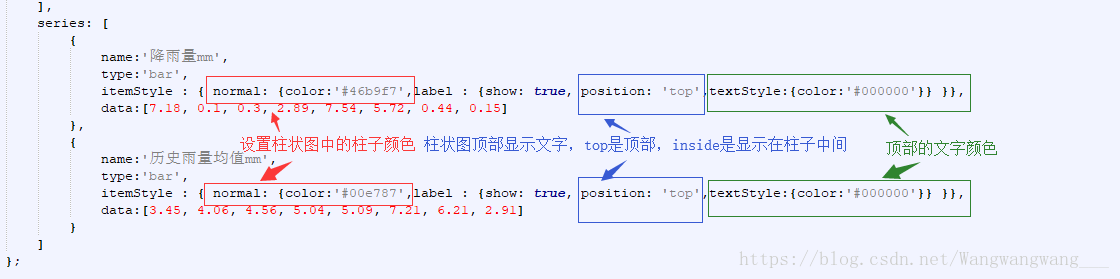
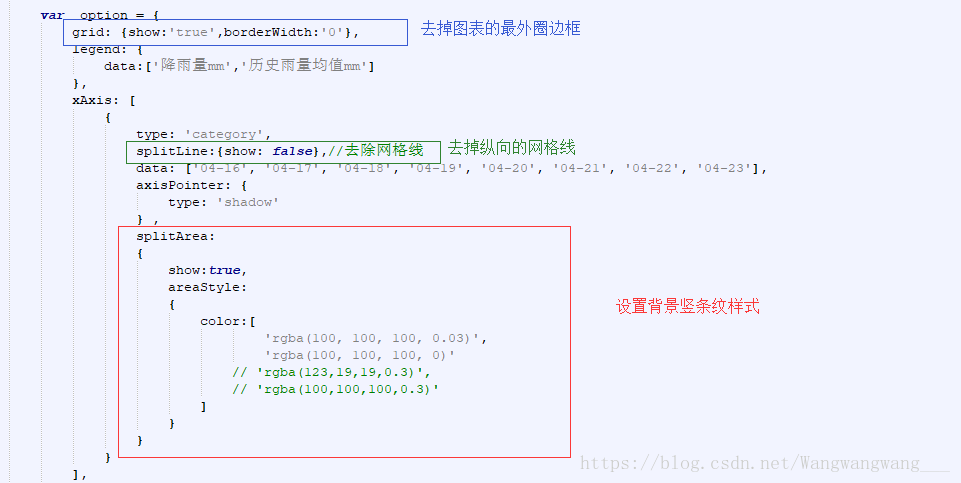
设置柱状图背景
完整代码:
 // 路径配置
    require.config({
        paths: {
            echarts: 'http://echarts.baidu.com/build/dist'
        }
    });

    // 使用
    require(
            [
                'echarts',
                'echarts/chart/line',//折线图
                'echarts/chart/bar' // 使用柱状图就加载bar模块,按需加载
            ],
            function (ec) {
                // 基于准备好的dom,初始化echarts图表
                var myChart = ec.init(document.getElementById('ttnEcharts'));

                option = {
                    // title: {
                    //     text: '折线图堆叠'
                    // },

                    tooltip: {
                        trigger: 'axis'
                    },
                    legend: {
                        data:['地温','历史地温均值']
                    },
                    grid: {
                        left: '3%',
                        right: '4%',
                        bottom: '3%',
                        containLabel: true,
                        borderWidth:'0'
                    },
                    toolbox: {
                        feature: {
                  &nbs
最低0.47元/天 解锁文章


 1万+
1万+

 被折叠的 条评论
为什么被折叠?
被折叠的 条评论
为什么被折叠?
 到【灌水乐园】发言


