


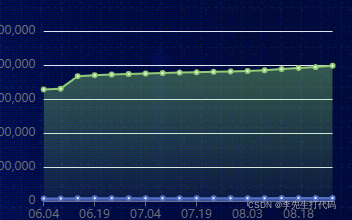
设置echarts折线图颜色渐变,配置areaStyle即可:
option = {
title: {
text: '折线图颜色渐变'
},
tooltip: {
trigger: 'axis'
},
grid: {
left: '3%',
right: '4%',
bottom: '3%',
containLabel: false
},
toolbox: {
feature: {
saveAsImage: {}
}
},
xAxis: {
type: 'category',
boundaryGap: false,
data: ['周一','周二','周三','周四','周五','周六','周日']
},
yAxis: {
type: 'value'
},
series: [
{
type:'line',
areaStyle: {normal: {
color: new echarts.graphic.LinearGradient(
0, 0, 0, 1,
[
{ offset: 0, color: "rgba(148,235,113,0.5)" },
{ offset: 0.5, color: "rgba(148,235,113,0.3)" },
{ offset: 1, color: "rgba(148,235,113,0.1)" },
]
)
}},
data:[120, 132, 101, 134, 90, 230, 210]
}
]
};


 3540
3540

 被折叠的 条评论
为什么被折叠?
被折叠的 条评论
为什么被折叠?
 到【灌水乐园】发言


