


说明:网络引用echarts.js和直接下载echarts引用的样式可能会不一致,需要对折线的样式和字体进行修改的请参考我的另外一篇文章https://blog.youkuaiyun.com/Wangwangwang___/article/details/81317732
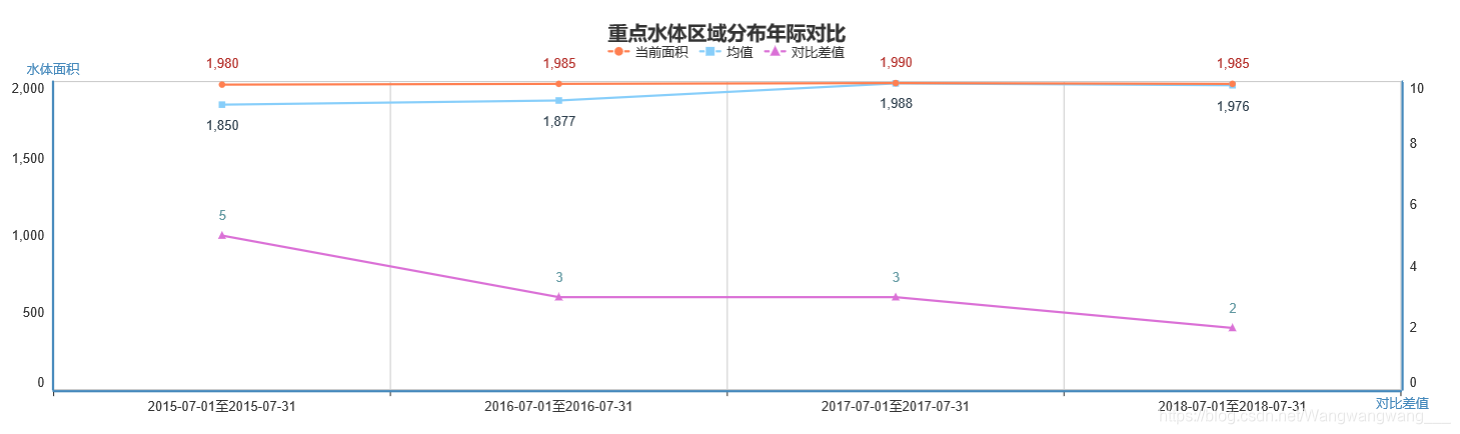
1、展示效果:
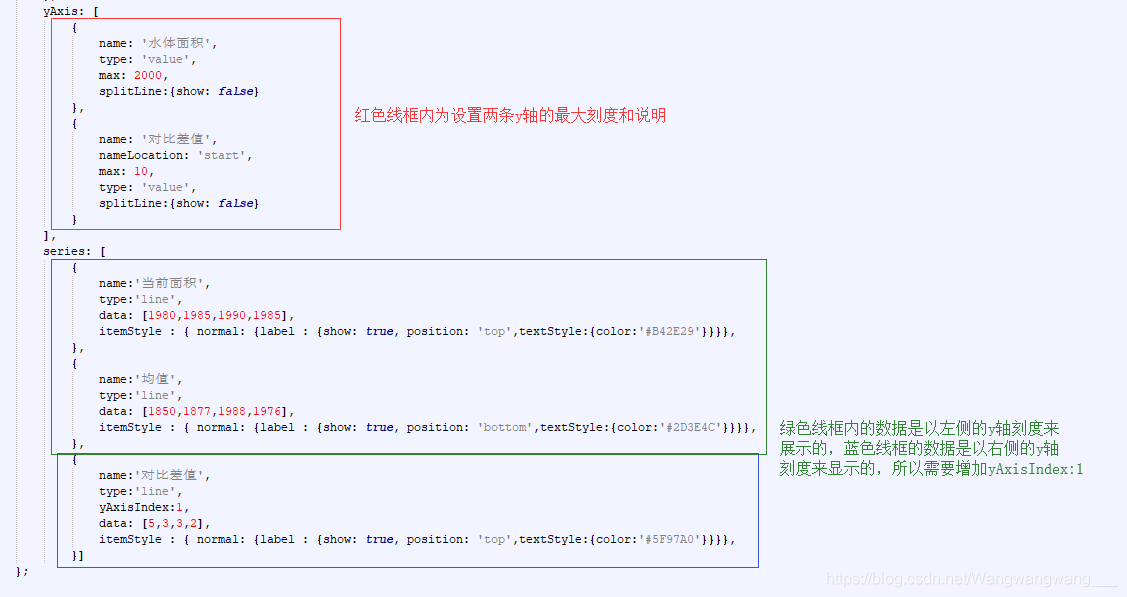
2、代码说明:
3、完整代码
 <div id="trmmEcharts"  class="echartsDiv"></div>

<script type="text/javascript">
    // 路径配置
    require.config({
        paths: {
            echarts: 'http://echarts.baidu.com/build/dist'
        }
    });

    // 使用
    require(
            [
                'echarts',
                'echarts/chart/line',//折线图
                'echarts/chart/bar' // 使用柱状图就加载bar模块,按需加载
            ],
            function (ec) {
                // 基于准备好的dom,初始化echarts图表

                var myChartTrmm = ec.init(document.getElementById('trmmEcharts'));

                var  option = {
                    title : {
                        text: '重点水体区域分布年际对比',
                        x:'center',
                        y:'top',
                    },
                    legend: {
                        data:['当前面积','均值','对比差值'],
                        y:'26'
                    },
                    tooltip: {
                        trigger: 'axis',
                        textStyle:{align:'left'}
                    },
                    grid: {
                        top: '22%',
                        left: '1%',
                        right: '1%',
                        bottom: '10%',
                        containLabel: true
                    },
                    xAxis: {
                        type: 'category',
                        data: ['2015-07-01至2015-07-31','2016-07-01至2016-07-31','2017-07-01至2017-07-31','2018-07-01至2018-07-31']

                    },
                    yAxis: [
                        {
                            name: '水体面积',
                            type: 'value',
                            max: 2000,
                            splitLine:{show: false}
                        },
                        {
                            name: '对比差值',
                            nameLocation: 'start',
                            max: 10,
                            type: 'value',
                            splitLine:{show: false}
                        }
                    ],
                    series: [
                        {
                            name:'当前面积',
                            type:'line',
                            data: [1980,1985,1990,1985],
                            itemStyle : { normal: {label : {show: true, position: 'top',textStyle:{color:'#B42E29'}}}},
                        },
                        {
                            name:'均值',
                            type:'line',
                            data: [1850,1877,1988,1976],
                            itemStyle : { normal: {label : {show: true, position: 'bottom',textStyle:{color:'#2D3E4C'}}}},
                        },
                        {
                            name:'对比差值',
                            type:'line',
                            yAxisIndex:1,
                            data: [5,3,3,2],
                            itemStyle : { normal: {label : {show: true, position: 'top',textStyle:{color:'#5F97A0'}}}},
                        }]
                };

                // 为echarts对象加载数据
                myChartTrmm.setOption(option);
            }
    );
</script>


 3600
3600

 被折叠的 条评论
为什么被折叠?
被折叠的 条评论
为什么被折叠?
 到【灌水乐园】发言


