


 本文介绍了如何使用Python的GridSearchCV工具对分类算法进行参数调优,以提高分类结果。通过台湾某银行的信用卡数据集,作者展示了数据预处理、构建分类器的过程,并对支持向量机、决策树、随机森林、K邻近和AdaBoost等模型进行参数调整,如决策树的最大深度、随机森林的决策树数量等。GridSearchCV_work()函数用于寻找最优参数并打印准确率。
一. 练习背景
在做分类算法的时候经常需要调节模型的构造参数以得到更好的分类结果. 但每一个分类算法有很多参数, 手动调参会非常耗时.
Python 给我们提供了一个很好用的工具 GridSearchCV, 它是 python 的参数自动搜索模块. 工具使用的参数和方法可以参考: https://blog.youkuaiyun.com/tensorflow66/article/details/79772304.
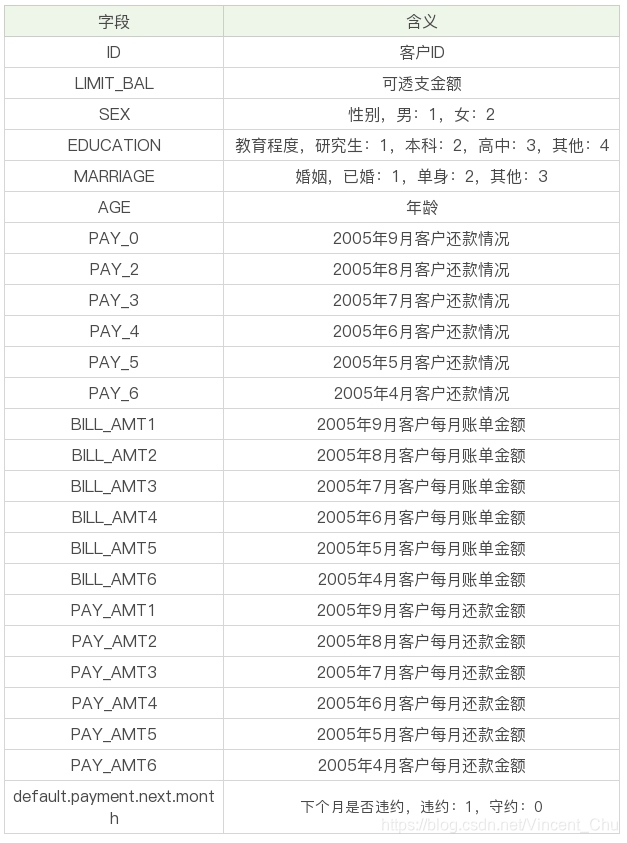
数据集是台湾某银行05年4月到9月的信用卡数据, 数据集一共3万条, 包括25个字段, 字段具体含义如图:
本例通过 sklearn 的 pipeline 工具进行管道串联, 先对处理好的数据进行 Z-Score 标准化, 再使用 GridSearchCV 调参, 最后使用最优的参数对测试集进行预测.
二. 数据分析
(一) 数据预处理
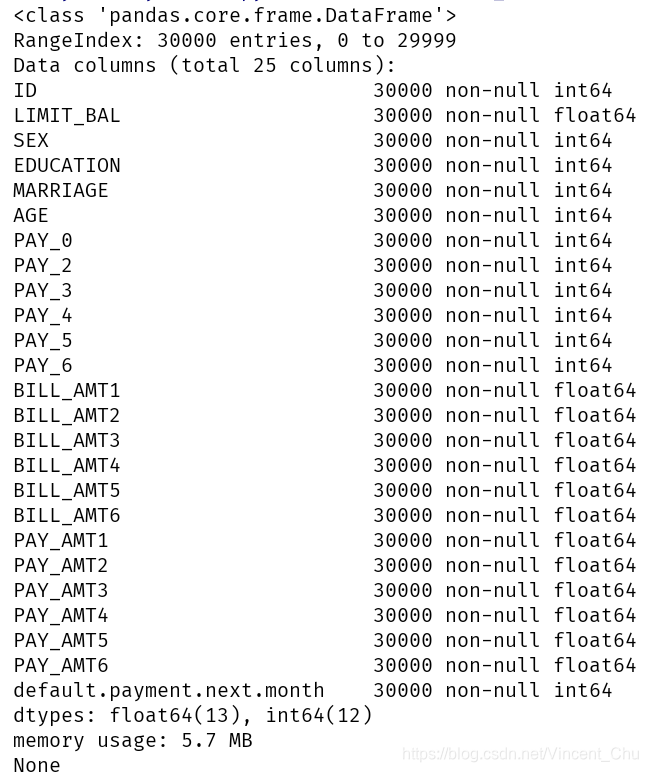
用 pandas 读入 csv 文件, 通过 .info() 查看数据基本信息, 数据并无缺失值:
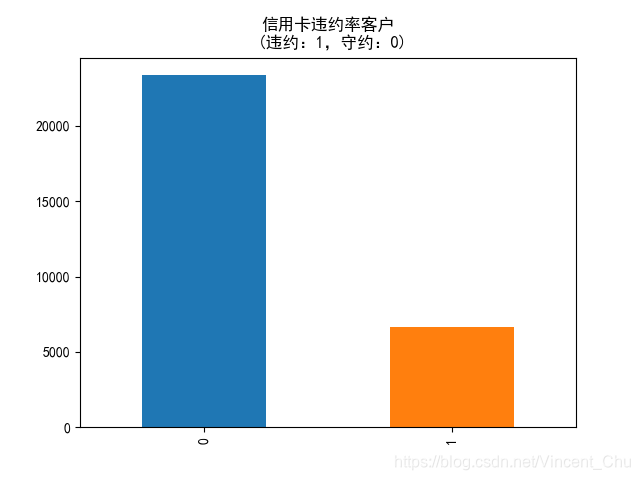
default.payment.next.month 列为'下月是否违约', 使用 .value_counts() 方法对违约和非违约数量进行统计, 并绘制条形统计图:
把 default.payment.next.month 作为 数据的输出标签, 其他除 ID 列 作为数据的特征信息, 使用 sklearn 中的train_test_split 把数据按 7: 3 分为训练集和测试集.
预处理代码:
# 数据探索
data = pd.read_csv('./UCI_Credit_Card.csv')
print(data.info())
# print(data.describe())
label_counts = data['default.payment.next.month'].value_counts()
print(label_counts)
label_counts.plot(kind='bar')
plt.title('信用卡违约率客户\n (违约:1,守约:0)')
plt.show()

# 训练集测试集分离
labels = data['default.payment.next.month'].values
columns_ = data.columns[1: -2]
features = data[columns_].values
train_x, test_x, train_y, test_y = train_test_split(features, labels, test_size=.3, stratify=labels, random_state=33)
(二) 分类器构建
分别使用支持向量机, 决策树, 随机森林, K邻近, AdaBoost 五种分类法进行调参. 其中比较的参数为:
1. 决策树, 树最大深度: 取 6, 9, 11 三个值
2. 随机森林, 决策树个数: 取3, 5, 6 三个值
3. K邻近, '邻居'数量: 取4, 6, 8 三个值
4. AdaBoost, 最大迭代次数: 取 10, 50, 100 三个值
首先构建三个列表:
# 构造各种分类器
classifiers = [
    SVC(random_state=1, kernel='rbf'),
    DecisionTreeClassifier(random_state=1, criterion='gini'),
    RandomForestClassifier(random_state=1, criterion='gini'),
    KNeighborsClassifier(metric='minkowski'),
    AdaBoostClassifier(base_estimator=None),
]
# 分类器名称
classifier_names = [
    'svc',
    'decisiontreeclassifier',
    'randomforestclassifier',
    'kneighborsclassifier',
    'adaboost',
]
# 分类器参数
classifier_param_grid = [
    {'svc__C': [1], 'svc__gamma': [0.01]},
    {'decisiontreeclassifier__max_depth': [6, 9, 11]},
    {'randomforestclassifier__n_estimators': [3, 5, 6]},
    {'kneighborsclassifier__n_neighbors': [4, 6, 8]},
    {'adaboost__n_estimators': [10, 50, 100]},
]
再定义 GridSearchCV_work() 函数, 功能为传入某一种模型、规范化后的训练测试集和分类器参数, 进行 GridSearchCV 参数调优, 并打印最优参数、最优分数与测试集的 accuracy 准确率.
# 使用 GridSearchCV 进行参数调优
def GridSearchCV_work(model_name, pipeline, train_x, train_y, test_x, test_y, param_grid, score='accuracy'):
    gridsearch = GridSearchCV(estimator=pipeline, param_grid=param_grid, scoring=score, cv=3)
    # 寻找最优的参数 和最优的准确率分数
    search = gridsearch.fit(train_x, train_y)
    print(model_name + ':')
    print("GridSearch最优参数:", search.best_params_)
    print("GridSearch最优分数: %0.4lf" % search.best_score_)
    predict_y = gridsearch.predict(test_x)
    print("测试集准确率 %0.4lf" % accuracy_score(test_y, predict_y))
最后使用 for 循环, 使数据进行规范化后再相应的分类模型下寻找最优参数.
# 通过 for 循环调用函数
for model, model_name, model_param_grid in zip(classifiers, classifier_names, classifier_param_grid):
    pipeline = Pipeline([
        ('scaler', StandardScaler()),
        (model_name, model)
    ])
    GridSearchCV_work(model_name, pipeline, train_x, train_y, test_x, test_y, model_param_grid, score='accuracy')
打印结果如下:
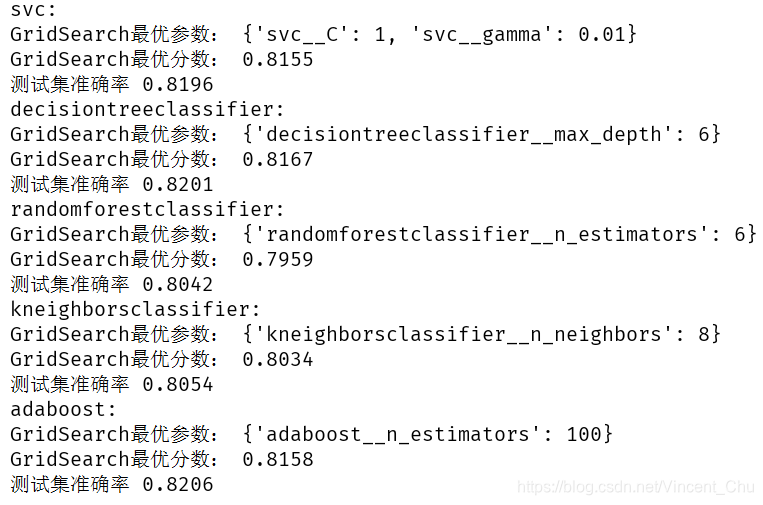
从上图可以得到一些想要的信息, 在此不做描述分析. 练习到此结束.


 513
513

 被折叠的 条评论
为什么被折叠?
被折叠的 条评论
为什么被折叠?
 到【灌水乐园】发言


