


 本文详细介绍了概率图模型(PGM),包括其定义、为何需要PGM、PGM的三个主要部分(表示、推断和学习)。特别讨论了有向图模型(贝叶斯网络)和无向图模型(马尔科夫随机场)的结构和性质,以及它们在概率分布表示中的应用。PGM通过图形化方式简化了高维数据的条件依赖结构,便于理解和计算。
往期文章链接目录
文章目录
Probabilistic Graphical Model (PGM)
Definition: A probabilistic graphical model is a probabilistic model for which a graph expresses the conditional dependence structure between random variables.
In general, PGM obeys following rules:
Sum Rule : p ( x 1 ) = ∫ p ( x 1 , x 2 ) d x 2 Product Rule : p ( x 1 , x 2 ) = p ( x 1 ∣ x 2 ) p ( x 2 ) Chain Rule: p ( x 1 , x 2 , ⋯ , x p ) = ∏ i = 1 p p ( x i ∣ x i + 1 , x i + 2 … x p ) Bayesian Rule: p ( x 1 ∣ x 2 ) = p ( x 2 ∣ x 1 ) p ( x 1 ) p ( x 2 ) \begin{aligned} &\text {Sum Rule : } p\left(x_{1}\right)=\int p\left(x_{1}, x_{2}\right) d x_{2}\\ &\text {Product Rule : } p\left(x_{1}, x_{2}\right)=p\left(x_{1} | x_{2}\right) p\left(x_{2}\right)\\ &\text {Chain Rule: } p\left(x_{1}, x_{2}, \cdots, x_{p}\right)=\prod_{i=1}^{p} p\left(x_{i} | x_{i+1, x_{i+2}} \ldots x_{p}\right)\\ &\text {Bayesian Rule: } p\left(x_{1} | x_{2}\right)=\frac{p\left(x_{2} | x_{1}\right) p\left(x_{1}\right)}{p\left(x_{2}\right)} \end{aligned} Sum Rule : p(x1)=∫p(x1,x2)dx2Product Rule : p(x1,x2)=p(x1∣x2)p(x2)Chain Rule: p(x1,x2,⋯,xp)=i=1∏pp(xi∣xi+1,xi+2…xp)Bayesian Rule: p(x1∣x2)=p(x2)p(x2∣x1)p(x1)
As the dimension of the data increases, the chain rule is harder to compute. In fact, many models try to simplify it in some ways.
Why we need probabilistic graphical models
Reasons:
-
They provide a simple way to visualize the structure of a probabilistic model and can be used to design and motivate new models.
-
Insights into the properties of the model, including conditional independence properties, can be obtained by inspection of the graph.
-
Complex computations, required to perform inference and learning in sophisticated models, can be expressed in terms of graphical manipulations, in which underlying mathematical expressions are carried along implicitly.
Three major parts of PGM
-
Representation: Express a probability distribution that models some real-world phenomenon.
-
Inference: Obtain answers to relevant questions from our models.
-
Learning: Fit a model to real-world data.
We are going to mainly focus on Representation in this post.
Representation
Representation: Express a probability distribution that models some real-world phenomenon.
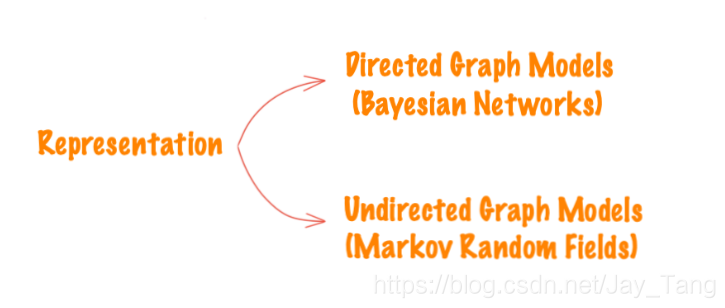
Directed graphical models (Bayesian networks)
Directed graphical models is also known as Bayesian networks.
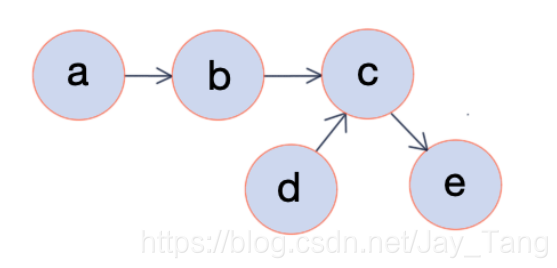
Intuition:
In a directed graph, vertices correspond to variables x i x_i x
 最低0.47元/天 解锁文章


 842
842


 到【灌水乐园】发言


