from numpy import *
import matplotlib.pyplot as plt
def makeLinearSeparableData(weights, numLines):
w = array(weights)
numFeatures = len(weights)
dataSet = zeros((numLines, numFeatures + 1))
for i in range(numLines):
x = random.rand(1, numFeatures) * 20 - 10
innerProduct = sum(w * x)
if innerProduct <= 0:
dataSet[i] = append(x, -1)
else:
dataSet[i] = append(x, 1)
return dataSet
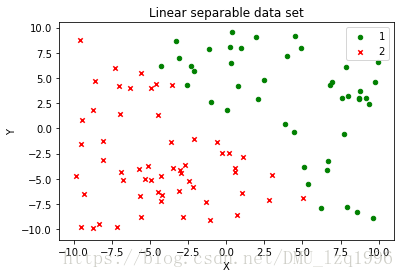
def plotData(dataSet):
fig = plt.figure()
ax = fig.add_subplot(111)
ax.set_title('Linear separable data set')
plt.xlabel('X')
plt.ylabel('Y')
labels = array(dataSet[:,2])
idx_1 = where(dataSet[:,2]==1)
p1 = ax.scatter(dataSet[idx_1,0], dataSet[idx_1,1], marker='o', color='g', label=1, s=20)
idx_2 = where(dataSet[:,2]==-1)
p2 = ax.scatter(dataSet[idx_2,0], dataSet[idx_2,1], marker='x', color='r', label=2, s=20)
plt.legend(loc = 'upper right')
plt.show()
def train(dataSet, plot = False):
numLines = dataSet.shape[0]
numFeatures = dataSet.shape[1]
w = zeros((1, numFeatures - 1))
separated = False
i = 0;
while not separated and i < numLines:
if dataSet[i][-1] * sum(w * dataSet[i,0:-1]) <= 0:
w = w + dataSet[i][-1] * dataSet[i,0:-1]
separated = False
i = 0;
else:
i += 1
if plot == True:
import matplotlib.pyplot as plt
from matplotlib.lines import Line2D
fig = plt.figure()
ax = fig.add_subplot(111)
ax.set_title('Linear separable data set')
plt.xlabel('X')
plt.ylabel('Y')
labels = array(dataSet[:,2])
idx_1 = where(dataSet[:,2]==1)
p1 = ax.scatter(dataSet[idx_1,0], dataSet[idx_1,1],
marker='o', color='g', label=1, s=20)
idx_2 = where(dataSet[:,2]==-1)
p2 = ax.scatter(dataSet[idx_2,0], dataSet[idx_2,1],
marker='x', color='r', label=2, s=20)
x = w[0][0] / abs(w[0][0]) * 10
y = w[0][1] / abs(w[0][0]) * 10
ann = ax.annotate(u"",xy=(x,y),
xytext=(0,0),size=20, arrowprops=dict(arrowstyle="-|>"))
ys = (-12 * (-w[0][0]) / w[0][1], 12 * (-w[0][0]) / w[0][1])
ax.add_line(Line2D((-12, 12), ys, linewidth=1, color='blue'))
plt.legend(loc = 'upper right')
plt.show()
return w
data = makeLinearSeparableData([4,3],100)
plotData(data)
train(data, plot = True)
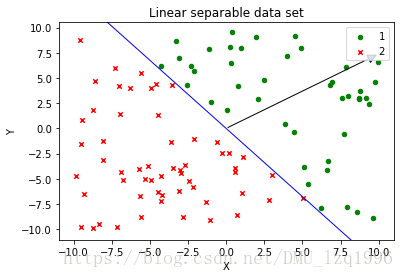
array([[ 7.82776047, 5.78641084]])


 9405
9405

 被折叠的 条评论
为什么被折叠?
被折叠的 条评论
为什么被折叠?
 到【灌水乐园】发言


