


一、知识准备
逻辑回归:又称Logistic回归分析,是一种广义的线性回归分析模型,常用于数据挖掘、疾病自动诊断、经济预测等领域。逻辑回归从本质来说属于二分类问题。二分类问题是指预测的y值只有两个取值(0或1)。
二、数据集描述
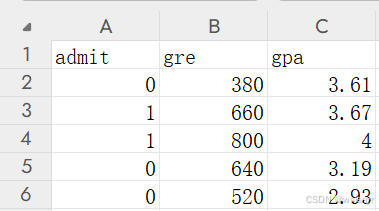
数据集文件:4_logisitic_admit.csv
数据集特征:
admit:学生是否被录取(0表示未被录取,1表示被录取)
gre:学生的考试成绩(范围是220—800)
gpa:学生的平均绩点(范围是2.26—4.0)
共400条记录
三、实验目的
1)构建一个逻辑回归模型,根据学生的GRE成绩和GPA预测其是否会被录取。
2)评估模型的性能。
四、实验步骤及结果展示
4.1 导入库
import pandas as pd
import numpy as np
import matplotlib.pyplot as plt
4.2 导入数据集
df = pd.read_csv('4_logisitic_admit.csv') #读取csv数据
df.head()
df.insert(1, 'Ones', 1) #在df插入全为1的一列
df.head(10) #展示df列表前10行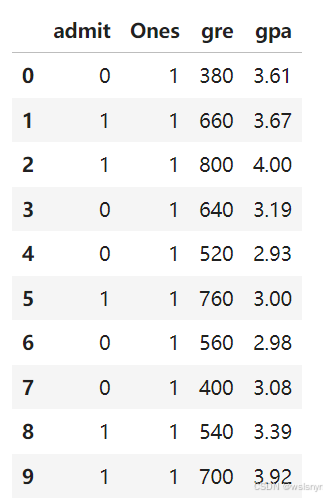
4.3 对训练集中的数据进行可视化
positive = df[df['admit'] == 1]  # 把admit为1的数据筛选出来形成单独的数据集
negative = df[df['admit'] == 0]  # 把admit为0的数据筛选出来形成单独的数据集
fig, ax = plt.subplots(figsize=(8, 5))  # 创建子图,大小为8*5
ax.scatter(positive['gre'], positive['gpa'], s=30, c='b', marker='o', label='admit')  # 构建positive的散点图,设置散点形状为o
ax.scatter(negative['gre'], negative['gpa'], s=30, c='r', marker='x', label='not admit')  # 构建negative的散点图,设置散点形状为x
ax.legend()  # 设置图例
ax.set_xlabel('gre')  # 设置x轴标签
ax.set_ylabel('gpa')  # 设置y轴标签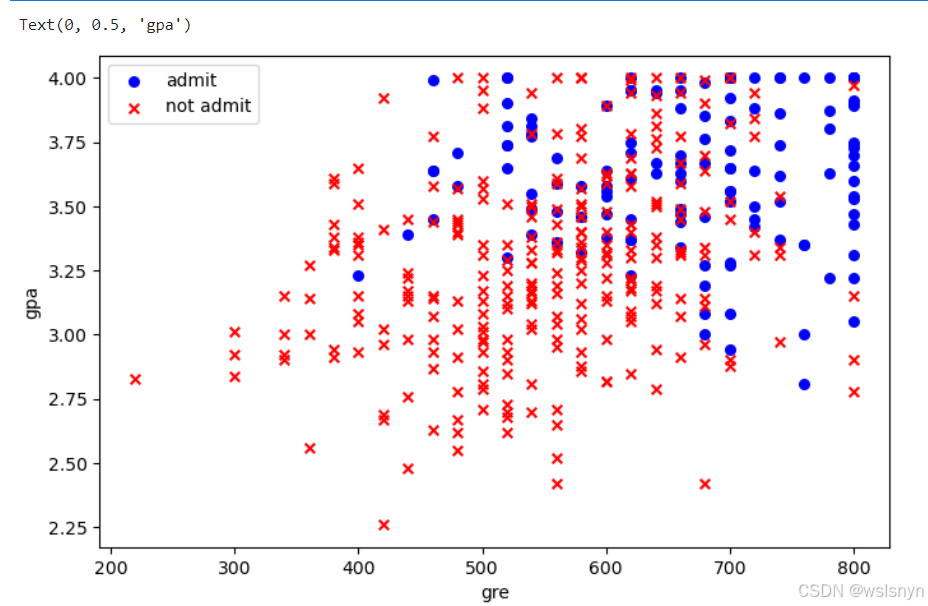
4.4 提取特征和目标变量
X = df.iloc[:, 1:4]  # 取df的第2到第4列为X变量
y = df['admit']  # 设置y变量
4.5 把X、y转化为数组形式,以便于计算
X = np.array(X.values)
y = np.array(y.values)
4.6 设置训练样本值m,变量个数n
m, n = np.shape(X)
theta = np.ones(n)  # 初始化theta
4.7 检查X与y的行列数,是否一致
print("X.shape:", X.shape)
print("theta.shape:", theta.shape)
print("y.shape:", y.shape)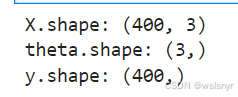
4.8 定义sigmoid函数
def sigmoid(z):
    return 1 / (1 + np.exp(-z))
4.9 定义代价函数
def costFunction(theta, X, y):
    m = len(y)
    h = sigmoid(X @ theta)
    cost = (-1 / m) * (y.T @ np.log(h) + (1 - y).T @ np.log(1 - h))
    return cost
4.10 定义梯度下降函数
def gradientDescent(X, y, theta, alpha, numIterations):
    m = len(y)
    for i in range(numIterations):
        h = sigmoid(X @ theta)
        gradient = (1 / m) * (X.T @ (h - y))
        theta = theta - alpha * gradient
    return theta
4.11 定义预测函数
def predict(theta, X):
    h = sigmoid(X @ theta)
    return (h >= 0.5).astype(int)
4.12 设置参数并训练模型
# 设置梯度下降参数
numIterations = 1000  # 迭代次数
alpha = 0.00001  # 学习率
# 训练模型
theta = gradientDescent(X, y, theta, alpha, numIterations)
print("Trained theta:", theta)![]()
4.13 预测结果并计算准确率
# 预测
pred = predict(theta, X)
# 计算准确率
correct = [1 if (a == b) else 0 for (a, b) in zip(pred, y)]
accuracy = (sum(correct) / len(correct)) * 100
print(f"accuracy = {accuracy:.2f}%")![]()
五、其他
本文中预测的准确率较低,如想要更高的准确率,可以通过特征工程、模型调参或换用复杂模型优化。


 被折叠的 条评论
为什么被折叠?
被折叠的 条评论
为什么被折叠?
 到【灌水乐园】发言


