前言
基于echarts5.x和vue2实现
记录以便日后查阅
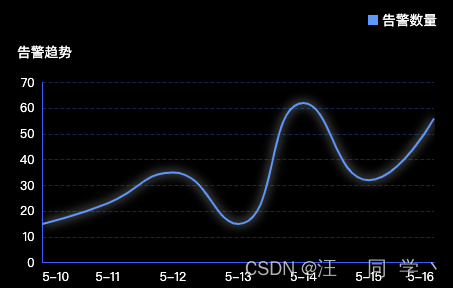
实现效果
代码实现
<template>
<div class="chart-wrap">
<ul class="legend-list">
<li
v-for="(item, index) in legend"
:key="index"
:class="['legend', item.selected ? '': 'un-active']"
@mouseenter="enterHandler(item)"
@mouseleave="leaveHandler(item)"
@click="clickHandler(item)"
>
<i class="rect" :style="{ backgroundColor: item.color }" />
<span>{{ item.name }}</span>
</li>
</ul>
<div id="chart19" class="chart" />
</div>
</template>
<script>
export default {
name: 'Index',
data () {
return {
chart: null,
legend: [{ name: '告警数量', color: '#54A6FD', selected: true }],
}
},
mounted() {
this.createChartHandler()
},
methods: {
createChartHandler () {
this.chart = this.$echarts.init(document.getElementById('chart19'))
this.chart.setOption(this.getChartOption(this.legend))
window.addEventListener('resize', () => {
setTimeout(() => {
this.chart.resize()
})
})
},
getChartOption (legend) {
return {
legend: {
show: false,
data: legend.map(i => i.name)
},
textStyle: {
fontFamily: 'PingFangReg'
},
title: {
text: '告警趋势',
textStyle: {
color: '#fff',
fontSize: 14,
fontWeight: 400
},
padding: [0, 0, 0, 20]
},
grid: {
top: '15%',
left: '5%',
right: '5%',
bottom: '5%',
containLabel: true
},
tooltip: {
trigger: 'axis',
extraCssText:
'color:#ffffff;background: #002C6C;border:none; box-shadow: 0px 0px 8px 1px rgba(0, 145, 255, 0.5);border-radius: 2px;',
confine: true,
textStyle: {
fontSize: 12,
color: '#ffffff'
},
formatter: '{a}: {c}'
},
dataset: {
source: [
['product', '告警数量']
]
},
xAxis: {
type: 'category',
boundaryGap: false,
data: [
{ value: '5-10', textStyle: { align: 'left' }},
{ value: '5-11', textStyle: { align: 'center' }},
{ value: '5-12', textStyle: { align: 'center' }},
{ value: '5-13', textStyle: { align: 'center' }},
{ value: '5-14', textStyle: { align: 'center' }},
{ value: '5-15', textStyle: { align: 'center' }},
{ value: '5-16', textStyle: { align: 'right' }}
],
axisTick: {
show: false
},
axisLine: {
lineStyle: {
color: '#2A6DFB'
}
},
axisLabel: {
textStyle: {
color: '#fff'
}
}
},
yAxis: {
type: 'value',
axisLabel: {
textStyle: {
color: '#fff'
}
},
axisLine: {
show: true,
lineStyle: {
color: '#2A6DFB'
}
},
splitLine: {
show: true,
lineStyle: {
type: 'dashed',
color: 'rgba(0,145,255,.3)'
}
}
},
series: [
{
name: '告警数量',
type: 'line',
data: [15, 23, 35, 15, 62, 32, 56],
smooth: true,
symbol: 'circle',
showSymbol: false,
symbolSize: 8,
itemStyle: {
color: '#fff',
shadowColor: 'rgba(255, 255, 255, .5)',
shadowBlur: 10
},
lineStyle: {
color: '#54A6FD',
shadowColor: 'rgba(255, 255, 255, 1)',
shadowBlur: 10
}
}
]
}
},
enterHandler (item) {
if (!this.chart) return
this.chart.dispatchAction({
type: 'highlight',
name: item.name
})
},
leaveHandler (item) {
if (!this.chart) return
this.chart.dispatchAction({
type: 'downplay',
name: item.name
})
},
clickHandler (item) {
if (!this.chart) return
item.selected = !item.selected
this.chart.dispatchAction({
type: 'legendToggleSelect',
name: item.name
})
}
}
}
</script>


 这篇博客详细记录了如何基于Echarts5.x和Vue2框架实现一个告警趋势的图表组件。内容包括模板结构、数据初始化、图表创建、图例交互以及鼠标事件处理等,完整展示了从数据到可视化的全过程。图表包含线性图、图例、提示框、坐标轴等元素,并实现了动态高亮和图例切换功能。


 389
389

 被折叠的 条评论
为什么被折叠?
被折叠的 条评论
为什么被折叠?
 到【灌水乐园】发言


