


 本文详细介绍了使用Vue3.0和ECharts构建一个大数据可视化的项目流程,包括项目初始化、响应式设计、ECharts图表配置、axios的使用、Express后端接口创建、跨域问题的解决、地图展示以及项目打包等关键步骤,实现了一个功能丰富的数据展示应用。
项目结构
myapp文件夹:前端
项目初始化
进入app.vue,清空所有外在样式
<style lang="less">
* {


  margin: 0;
  padding: 0;
  // 解析的时候,边框、内边距等是包含在width中的
  box-sizing: border-box;
}
</style>
项目分辨率响应——lib-flexible
项目页面布局随窗口大小改变而改变
使用第三方库lib-flexible,rem屏幕适配
myapp> npm install --save lib-flexible
然后在main.js里面引用插件
import 'lib-flexible/flexible'
由于它默认的分辨率是在指定的范围内生效的,所以我们需要根据当前的项目进行分辨率的调整
进入以下文件,修改默认的配置文件
以下是默认配置
function refreshRem(){


        var width = docEl.getBoundingClientRect().width;
        if (width / dpr > 540) {


            width = 540 * dpr;
        }
        var rem = width / 10;
        docEl.style.fontSize = rem + 'px';
        flexible.rem = win.rem = rem;
    }
以下是修改好的配置
function refreshRem(){


        var width = docEl.getBoundingClientRect().width;
        // if (width / dpr > 540) {


        //     width = 540 * dpr;
        // }
        // var rem = width / 10;

        // 修改 最小值400 最大值2560
        if (width / dpr < 400) {


            width = 400 * dpr;
        } else if (width / dpr > 2560) {


            width = 2560 * dpr;
        }
        // 设置成24份,美工给设计稿1920px,除以24刚好就是80px
        // 1rem 就是 80px
        var rem = width / 24;
        docEl.style.fontSize = rem + 'px';
        flexible.rem = win.rem = rem;
    }
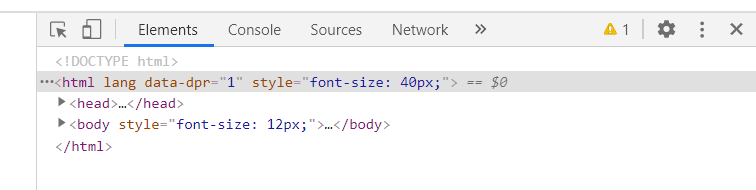
修改完配置文件,记得项目需要重启
效果如下,注意font-size随着窗口大小的改变而改变
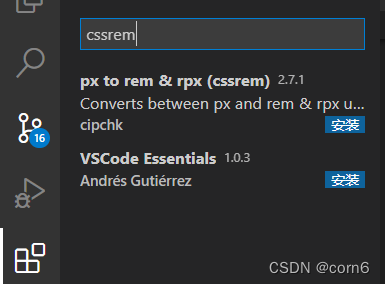
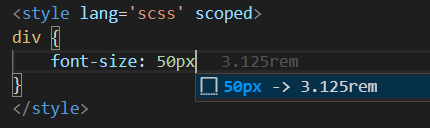
项目分辨率响应——px与rem转化插件
效果如下:
顶部信息条创建
在app.vue里面设置body背景图
body {


  background: url('~@/assets/bg.jpg') top center no-repeat;
  background-size: 100%;
}
创建顶部信息条,进入homePage.vue
<template>
  <div>
    <header>
      <h1>
        corn6——大数据可视化
      </h1>
    </header>
  </div>
</template>
header {


  height: 1.25rem;
  width: 100%;
  background-color: rgba(0, 0, 255, .2);
  /* 标题文字的样式 */
  h1 {


    font-size: .5rem;
    color: #fff;
    text-align: center;
    line-height: 1.25rem;
  }
}
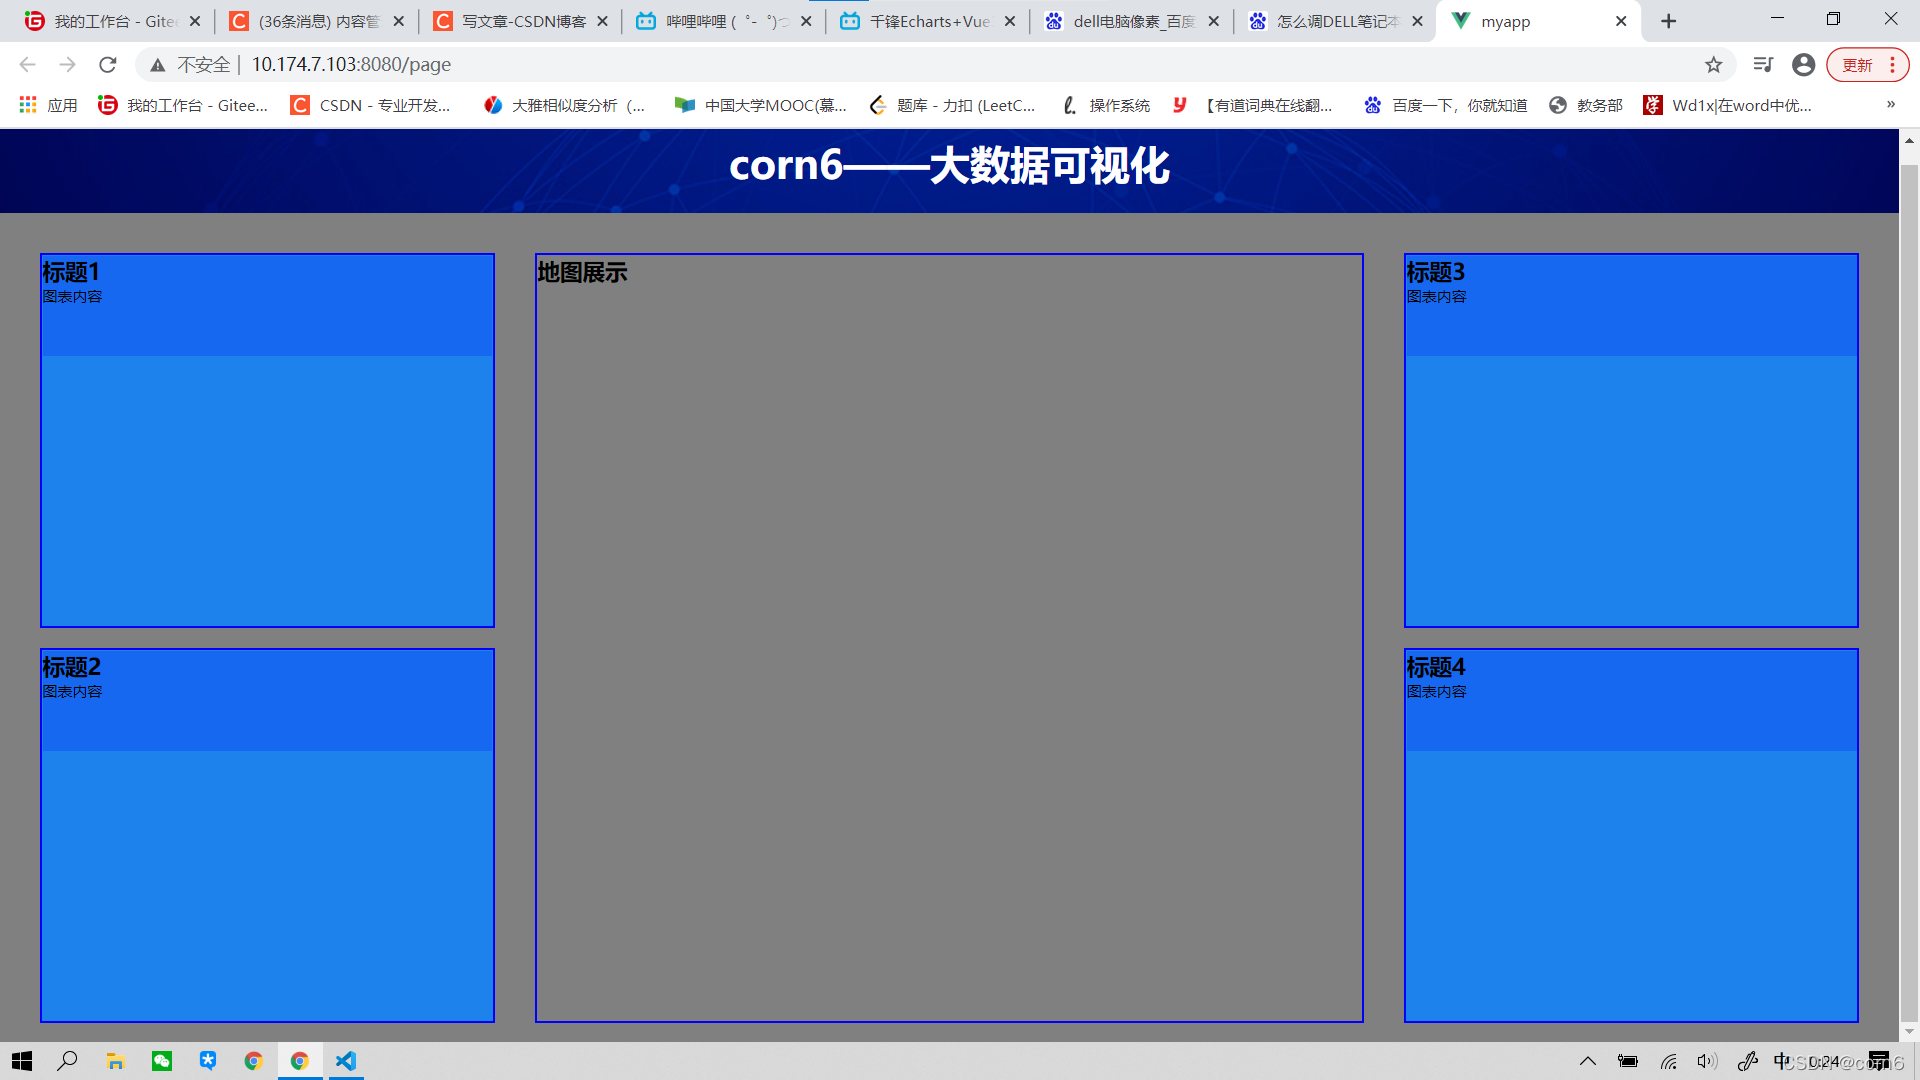
页面主体创建
划分左中右三个容器
<!-- 大容器 -->
    <section class="container">
      <!-- 左容器 -->
      <section class="leftItem">
      </section>
      <!-- 中容器 -->
      <section class="middleItem">
      </section>
      <!-- 右容器 -->
      <section class="rightItem">
      </section>
    </section>
/* 大容器的样式 */
.container {


  /* 固定值,不需要改变,不设置rem单位 */
  min-width: 1080px;
  max-width: 1900px;
  margin: 0 auto;
  padding: .625rem .625rem 0;
  background: gray;
  display: flex;
  /* 设置左右在页面的份数 */
  .leftItem, .rightItem {


    flex: 3;
  }
  .middleItem {


    flex: 5;
  }
}
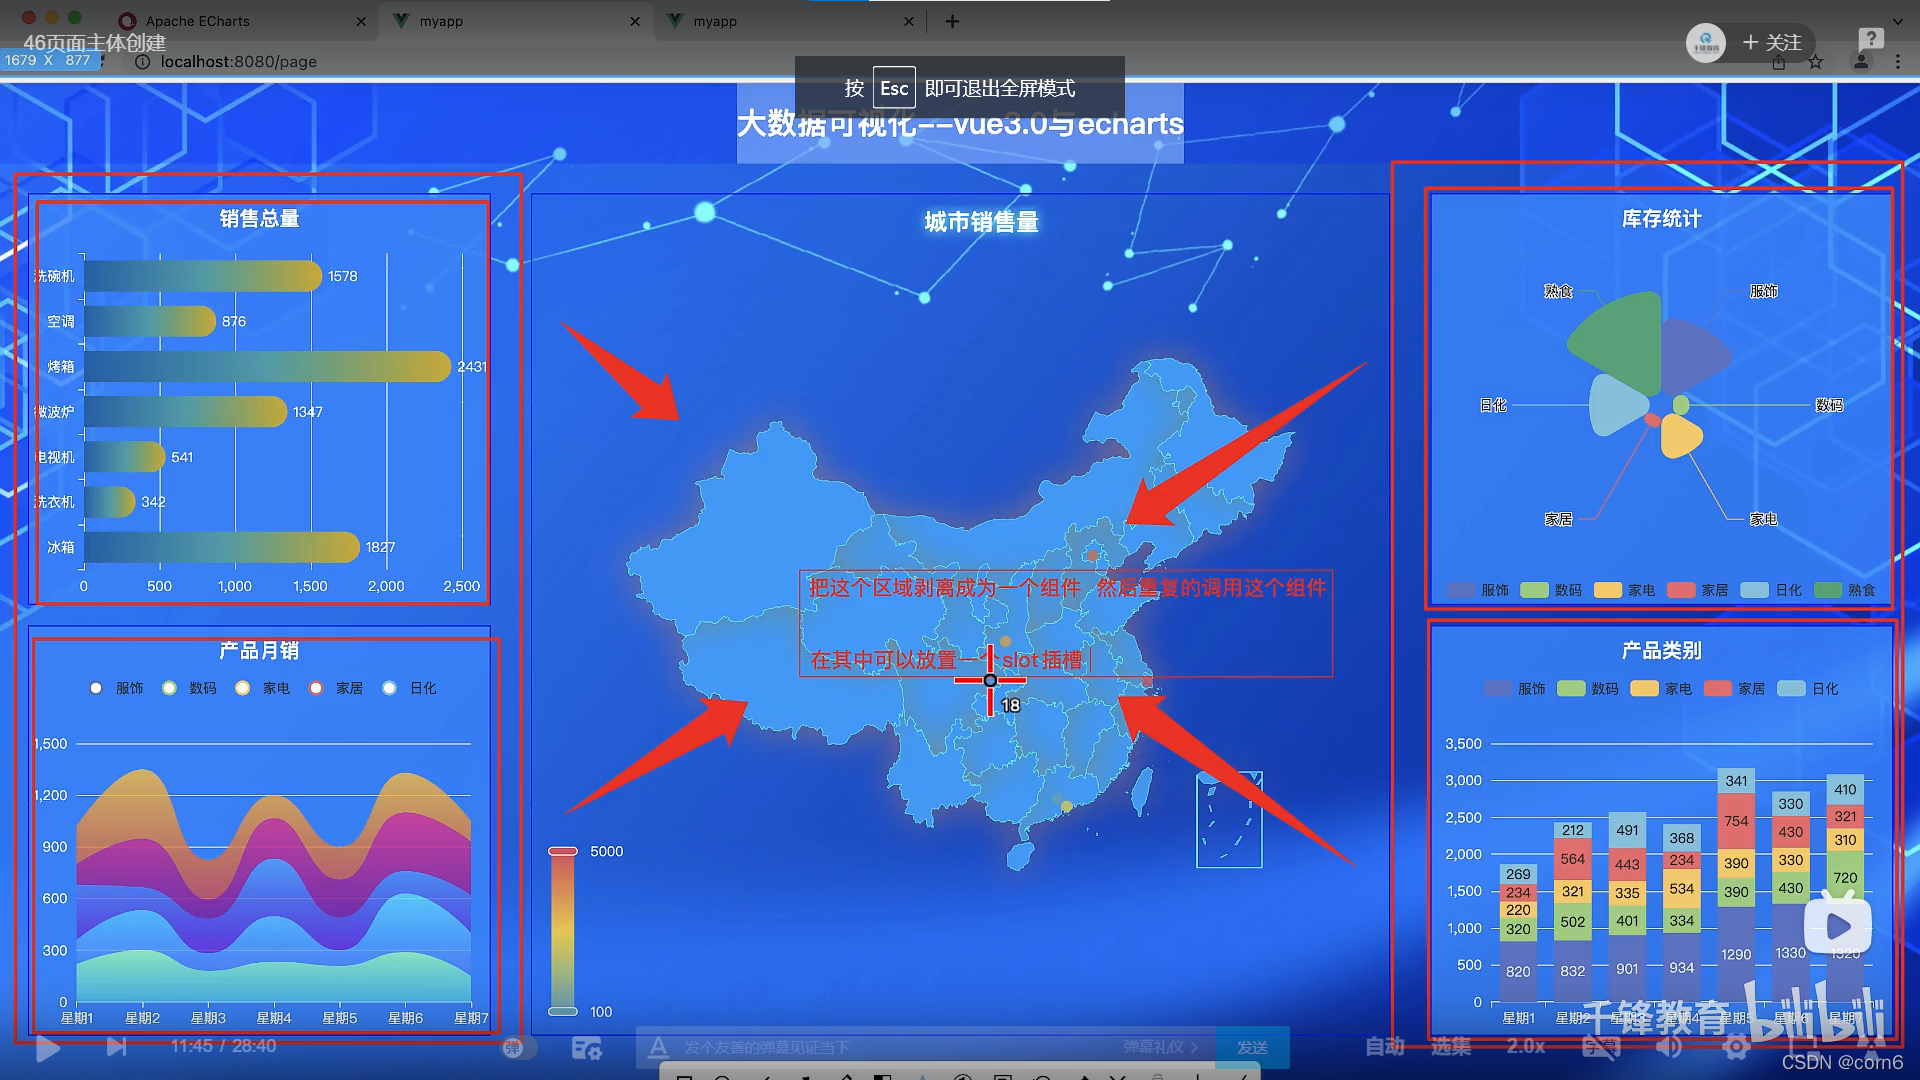
由于重复出现4个正方形区域,因此可以把这个区域剥离成为一个组件,然后在其中放置slot插槽,重复调用该组件
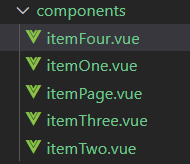
在components里面新建一个itemPage.vue
!<!--  -->
<template>
  <div class="item">
    <!-- 设置插槽 -->
    <slot></slot>
  </div>
</template>

<script>
export default {


  data () {


    return {


        name: 'itemPage'
    };
  },

  components: {

     },

  computed() {

     },

  mounted() {

     },

  methods: {

     }
}

</script>
<style lang='less' scoped>
.item {


    height: 12.5rem;
    border: .0313rem solid blue;
    margin: .3125rem;
    background-color: rgba(12, 130, 255, .85);
}
</style>
然后在homepage里面引用
<!-- 大容器 -->
    <section class="container">
      <!-- 左容器 -->
      <section class="leftItem">
        <ItemPage/>
        <ItemPage/>
      </section>
      <!-- 中容器 -->
      <section class="middleItem">
      </section>
      <!-- 右容器 -->
      <section class="rightItem">
        <ItemPage/>
        <ItemPage/>
      </section>
    </section>
再新建四个itemOne.vue组件,放置不同的标题图标
!<!--  -->
<template>
  <header>
    <h2>
        标题
    </h2>
    <div>
        图表内容
    </div>
  </header>
</template>

<script>
export default {


  data () {


    return {


    };
  },

  components: {

     },

  computed() {

     },

  mounted() {

     },

  methods: {

     }
}

</script>
<style lang='scss' scoped>
</style>
然后将四个组件嵌入插槽
<!-- 大容器 -->
    <section class="container">
      <!-- 左容器 -->
      <section class="leftItem">
        <ItemPage>
          <ItemOne/>
        </ItemPage>
        <ItemPage>
          <ItemTwo/>
        </ItemPage>
      </section>
      <!-- 中容器 -->
      <section class="middleItem">
      </section>
      <!-- 右容器 -->
      <section class="rightItem">
        <ItemPage>
          <ItemThree/>
        </ItemPage>
        <ItemPage>
          <ItemFour/>
        </ItemPage>
      </section>
    </section>
  </div>
</template>

<script>
import ItemPage from "@/components/itemPage.vue";

import ItemOne from "@/components/itemOne.vue";
import ItemTwo from "@/components/itemTwo.vue";
import ItemThree from "@/components/itemThree.vue";
import ItemFour from "@/components/itemFour.vue";

export default {
  data () {
    return {
        name: 'homePage'
    };
  },

  components: {
    ItemPage,
    ItemOne,
    ItemTwo,
    ItemThree,
    ItemFour
  },
然后单独对中间区域进行样式设置
.middleItem {


    flex: 5;
    height: 9.625rem;
    border: .0313rem solid blue;
    margin: .25rem;
  }
引用echarts(provide/inject)
npm install --save echarts
在App.vue中,从vue中解构出provide,并引入echarts
import {

    provide } from "vue";
import * as echarts from "echarts";
然后使用provide,向所有后代提供数据
 最低0.47元/天 解锁文章


 1808
1808

 被折叠的 条评论
为什么被折叠?
被折叠的 条评论
为什么被折叠?
 到【灌水乐园】发言


