前言
基于echarts5.x和vue2实现
记录以便日后查阅
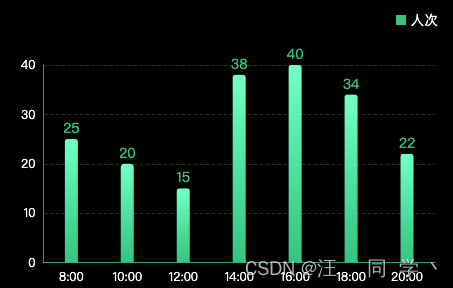
实现效果
代码实现
<template>
<div class="chart-wrap">
<ul class="legend-list">
<li
v-for="(item, index) in legend"
:key="index"
:class="['legend', item.selected ? '': 'un-active']"
@mouseenter="enterHandler(item)"
@mouseleave="leaveHandler(item)"
@click="clickHandler(item)"
>
<i class="rect" :style="{ backgroundColor: item.color }" />
<span>{{ item.name }}</span>
</li>
</ul>
<div id="chart18" class="chart" />
</div>
</template>
<script>
import echarts from '@/utils/echarts'
export default {
name: 'Index',
data () {
return {
chart: null,
legend: [{ name: '人次', color: 'rgba(6, 200, 140, 1)', selected: true }],
yData: [25, 20, 15, 38, 40, 34, 22],
xData: ['8:00', '10:00', '12:00', '14:00', '16:00', '18:00', '20:00']
}
},
mounted() {
this.createChartHandler()
},
methods: {
createChartHandler () {
this.chart = this.$echarts.init(document.getElementById('chart18'))
this.chart.setOption(this.getChartOption(this.yData, this.xData, this.legend))
window.addEventListener('resize', () => {
setTimeout(() => {
this.chart.resize()
})
})
},
getChartOption (yData, xData, legend) {
return {
legend: {
show: false,
data: legend.map(i => i.name)
},
tooltip: {
trigger: 'item',
position: 'right',
extraCssText:
'color:#fff;background: rgba(0, 38, 118, 0.5);border:none; box-shadow: 0px 0px 8px 1px rgba(0, 145, 255, 0.5);border-radius: 2px;z-index:99',
formatter: function (params) {
return `
<span>${params.seriesName}</span><br>
${params.marker}<span>${params.name} </span><span>${params.data}</span>
`
}
},
textStyle: {
fontFamily: 'PingFangReg'
},
grid: {
top: '8%',
left: '5%',
right: '5%',
bottom: '5%',
containLabel: true
},
xAxis: {
type: 'category',
data: xData,
axisTick: {
show: false
},
axisLine: {
lineStyle: {
color: 'rgba(6, 200, 140, 0.79)'
}
},
axisLabel: {
textStyle: {
color: '#fff'
}
}
},
yAxis: {
interval: 10,
type: 'value',
axisLabel: {
textStyle: {
color: '#fff'
}
},
axisLine: {
show: true,
lineStyle: {
color: 'rgba(6, 200, 140, 0.79)'
}
},
splitLine: {
show: true,
lineStyle: {
type: 'dashed',
color: 'rgba(6, 200, 140, 0.29)'
}
}
},
series: [
{
name: legend[0].name,
data: yData,
type: 'bar',
label: {
normal: {
show: true,
distance: 4,
lineHeight: 14,
formatter: '{c}',
position: 'top',
textStyle: {
fontFamily: 'PingFangBold',
color: '#06C88C',
fontSize: 14
}
}
},
barWidth: 13,
itemStyle: {
normal: {
color: new echarts.graphic.LinearGradient(
0,
1,
0,
0,
[
{ offset: 0, color: 'rgba(6, 200, 140, 1)' },
{ offset: 1, color: 'rgba(100, 255, 207, 1)' }
],
false
),
barBorderRadius: [3, 3, 0, 0],
label: {
show: false,
position: 'top',
textStyle: {
color: '#fff'
}
}
}
}
}
]
}
},
enterHandler (item) {
if (!this.chart) return
this.chart.dispatchAction({
type: 'highlight',
name: item.name
})
},
leaveHandler (item) {
if (!this.chart) return
this.chart.dispatchAction({
type: 'downplay',
name: item.name
})
},
clickHandler (item) {
if (!this.chart) return
item.selected = !item.selected
this.chart.dispatchAction({
type: 'legendToggleSelect',
name: item.name
})
}
}
}
</script>


 229
229

 被折叠的 条评论
为什么被折叠?
被折叠的 条评论
为什么被折叠?
 到【灌水乐园】发言


