示例图片
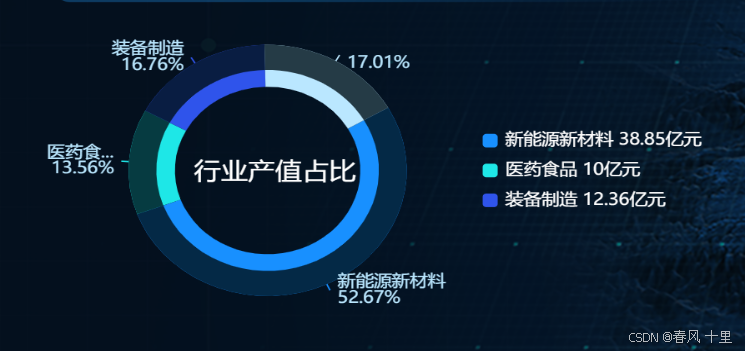
组件代码
<template>
<div class="annularChart" :id="chartId" :style="{ height: height, width: width }" />
</template>
<script>
export default {
name: 'IndustrialBrainNewMgmtFrontAnnularChart',
props: {
chartId: {
type: String,
default: 'annularChart'
},
width: {
type: String,
default: '100%'
},
height: {
type: String,
default: '100%'
},
chartData: {
type: Object,
default: () => { },
}
},
watch: {
chartData: {
handler(val) {
this.initChart();
},
deep: true,
}
},
data() {
return {
chart: null
};
},
mounted() {
},
methods: {
initChart() {
if (this.chart) this.chart.dispose();
this.chart = this.$echarts.init(document.getElementById(this.chartId));
const { tooltip = [], title = [], legend = {}, seriesConfig = [] } = this.chartData;
this.chart.setOption(this.pieOptions(tooltip, title, legend, seriesConfig));
},
pieOptions(tooltip, title, legend, seriesConfig) {
const seriesData = seriesConfig.map(item => {
return {
name: item.name || '',
type: 'pie',
startAngle: 30,
radius: item.radius || ['50%', '70%'],
center: item.center || ['50%', '50%'],
avoidLabelOverlap: true,
label: item.label || {
show: false,
},
emphasis: item.emphasis || {
scale: true,
label: {
show: false,
}
},
labelLine: item.labelLine || {
show: false
},
data: item.data || []
}
})
const option = {
tooltip: {
trigger: 'item',
backgroundColor: 'rgba(0,0,0,0.73)',
borderColor: '#00527B',
borderRadius: 4,
textStyle: {
fontSize: 12,
fontFamily: 'Microsoft YaHei',
fontWeight: 400,
color: '#FFFFFF',
height: 12,
textBorderType: 'solid'
},
formatter: tooltip.formatter || '{c}'
},
legend: Object.keys(legend).length === 0 ? {
show: false
} : legend,
title: title,
series: seriesData
};
return option
}
},
beforeDestroy() {
if (!this.chart) {
return
}
this.chart.dispose()
this.chart = null
},
};
</script>
<style lang="scss" scoped>
.annularChart {
flex: 1;
}
</style>
示例数据
const oldList = [
{ color: '#1890FF', itemColor: '#042946' },
{ color: '#1EE7E7', itemColor: '#063B41' },
{ color: '#2F54EB', itemColor: '#091D42' },
{ color: '#BAE7FF', itemColor: '#253B46' },
];
const list = res.data ? res.data.map((item, index) => ({
itemStyle: { color: oldList[index].color },
name: item.vueName,
value: item.actualValue,
unit: item.unit,
itemColor: oldList[index].itemColor,
})) : [];
this.industryList = {
title: [
{
text: '行业产值占比',
textStyle: { color: '#FFFFFF', fontWeight: 400, fontSize: '18px' },
left: '35%',
top: '45%',
textAlign: 'center',
},
],
legend: {
right: 0,
y: 'center',
orient: 'vertical',
itemHeight: 10,
itemWidth: 10,
textStyle: { color: '#FFFFFF' },
align: 'left',
formatter: function(name) {
let item = list.find(item => item.name === name);
return `${name} ${item ? item.value : ''}${item ? item.unit : ''}`;
}
},
seriesConfig: [
{
center: ['35%', '50%'],
radius: ['50%', '75%'],
emphasis: { scale: false, label: { show: false } },
label: { show: false },
data: list.map(item => ({
...item,
label: {
normal: {
show: true,
formatter: params => `${params.name}\n${params.percent}%`,
color: '#BAE7FF',
fontSize: 12,
},
},
labelLine: {
normal: {
show: true,
smooth: false,
length: 5,
length2: 0,
},
},
})),
},
{
center: ['35%', '50%'],
radius: ['60%', '75%'],
emphasis: { scale: false, label: { show: false } },
label: { show: false },
data: list.map(item => ({
...item,
itemStyle: { color: item.itemColor },
label: {
normal: {
show: false,
},
},
labelLine: {
normal: {
show: false,
},
},
})),
},
],
};


 3731
3731

 被折叠的 条评论
为什么被折叠?
被折叠的 条评论
为什么被折叠?
 到【灌水乐园】发言


