


 本文介绍了在Hough变换中,通过检测端点并连接它们来提高直线检测精度的方法。这种方法解决了因参数设置不当导致的检测误差问题,实验结果显示,相较于传统方法,新方法能获得更准确的检测结果。
之前尝试的方法是从一定区域内检测出单一线条,当设置参数不合适时,容易出现之前结果中出现的

检测结果明显有误差,这是设置取值过小导致整个区域不能纳入计算导致的,但是阈值设置过大会让整个区域别忽略
所以参看一些书籍资料学习了一种从Hough变换后提出多个端点,再连接端点构成检测出的直线的方法:
代码如下:
clear;
clc;

I=imread('abc.bmp');
I=rgb2gray(I);
imshow(I),title('原始图像');
figure;

I2=imopen(I,ones(4,4));
I2=imdilate(I2,ones(5,15));
imshow(I2),title('开、膨胀处理');
figure;

%I3=rgb2gray(I2);

[H,T,R]=hough(I2,'RhoResolution',0.5,'Theta',-90:0.5:89.5);
P=houghpeaks(H,10,'threshold',ceil(0.3*max(H(:))));
H=mat2gray(H);
H=imadjust(H,stretchlim(H),[]);
imshow(H,'Xdata',T,'Ydata',R,'Initialmagnification','fit');
title('Hough矩阵');

xlabel('\theta'),ylabel('\rho');
axis on,axis normal,hold on
x=T(P(:,2));y=R(P(:,1));
plot(x,y,'s','color','white');
lines=houghlines(I2,T,R,P,'FILLGAP',5,'minlength',7);
hold off

%img=mat2gray(zeros(size(I)));
%imshow(img),title('检测出的直线');
img=zeros(size(I));

imshow(img),title('检测出的直线');hold on
maxlen=0;
for k=1:length(lines)
    xy=[lines(k).point1;lines(k).point2];
    plot(xy(:,1),xy(:,2),'linewidth',2,'Color','white');
    plot(xy(1,1),xy(1,2),'x','linewidth',2,'Color','white');
    plot(xy(2,1),xy(2,2),'x','linewidth',2,'Color','white');
    len=norm(lines(k).point1-lines(k).point2);
    if(len>maxlen)
        maxlen=len;
        xy_long=xy;
    end
end
plot(xy_long(:,1),xy_long(:,2),'linewidth',2,'Color','red');
hold off
结果如下:
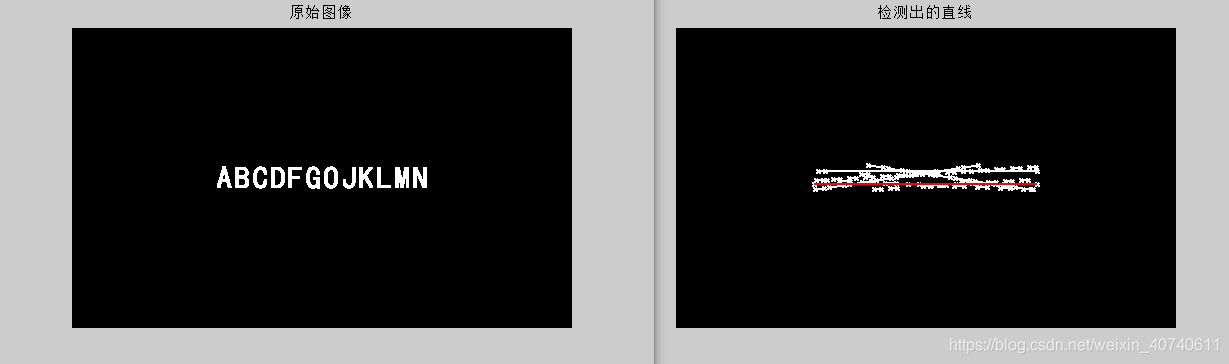
图二中白色线条为检测端点得到的直线,红色线条为综合最长距离的线条,相比之前的办法得到的检测直线而言,这个方法得到的结果更加准确。


 被折叠的 条评论
为什么被折叠?
被折叠的 条评论
为什么被折叠?
 到【灌水乐园】发言


