


 本文介绍了正态分布(也称为高斯分布)的基本概念及其在统计学中的应用,并通过MATLAB代码示例展示了如何进行正态分布的概率密度函数拟合与QQ图绘制。
一、简介
正态分布(Normal distribution)又名高斯分布(Gaussian distribution),是一个在数学、物理及工程等领域都非常重要的概率分布,在统计学的许多方面有着重大的影响力。
若随机变量X服从一个数学期望为μ、标准方差为σ2的高斯分布,记为:
- X∼N(μ,σ2),
则其概率密度函数为
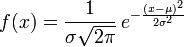
正态分布的期望值μ决定了其位置,其标准差σ决定了分布的幅度。因其曲线呈钟形,因此人们又经常称之为钟形曲线。我们通常所说的标准正态分布是μ = 0,σ = 1的正态分布。
二、代码
(1)pdf 和 cdf函数的说明、
Probability density function(PDF) 概率密度函数;
cumulative distribution function ; CDF 是累积分布函数
(2)正态分布(normpdf normcdf)
- clc
- clear all
- close all
- dataall = load('G:\zyp_thanks\metro_test\1-07\529_2.csv');
- data = dataall(:,3);%指定列
- [mu,sigma]=normfit(data);%estimate of the mean and standard deviation in data
- [y,x]=hist(data,6);%creates a histogram bar plot of data,sorts data into the number of bins specified by nbins
- %return the categorical levels correponding to each count in N
- bar(x,y,'FaceColor','r','EdgeColor','w');box off
- xlim([mu-3*sigma,mu+3*sigma]) % sets the axis limits in the current axes to the specified values
- a2=axes;
- % computes the pdf at each of the values in X using the normal distribution
- % with mean and standard deviation sigma.
- ezplot(@(x)normpdf(x,mu,sigma),[mu-3*sigma,mu+3*sigma])
- set(a2,'box','off','yaxislocation','right','color','none')
- title '频数直方图与正态分布密度函数(拟合)'

(3) quantile - quantile plot (Q-Q plot)


 358
358

 被折叠的 条评论
为什么被折叠?
被折叠的 条评论
为什么被折叠?
 到【灌水乐园】发言


