


 本文介绍了Python的matplotlib库中pyplot模块的annotate()函数,用于在图形上添加文本注解。示例展示了如何设置注解的文本、位置、坐标系以及箭头属性,帮助理解如何在图表中创建指向特定数据点的注解。
Matplotlib是Python中的一个库,它是数字的-NumPy库的数学扩展。 Pyplot是Matplotlib模块的基于状态的接口,该模块提供了MATLAB-like接口。
matplotlib.pyplot.annotate()功能
matplotlib库的pyplot模块中的annotate()函数用于用文本s注释点xy。
用法: angle_spectrum(x, Fs=2, Fc=0, window=mlab.window_hanning, pad_to=None, sides=’default’, **kwargs)
参数:此方法接受以下描述的参数:
s:此参数是注释的文本。
xy:此参数是要注释的点(x,y)。
xytext:此参数是可选参数。它是放置文本的位置(x,y)。
xycoords:此参数也是可选参数,包含字符串值。
textcoords:此参数包含字符串值。xytext的坐标系,可能与xy所使用的坐标系不同
arrowprops:该参数也是可选参数,包含dict类型,默认值为None。
annotation_clip:该参数也是可选参数,包含布尔值,其默认值为None,其行为为True。
返回值:此方法返回注释。
以下示例说明了matplotlib.pyplot中的matplotlib.pyplot.annotate()函数:
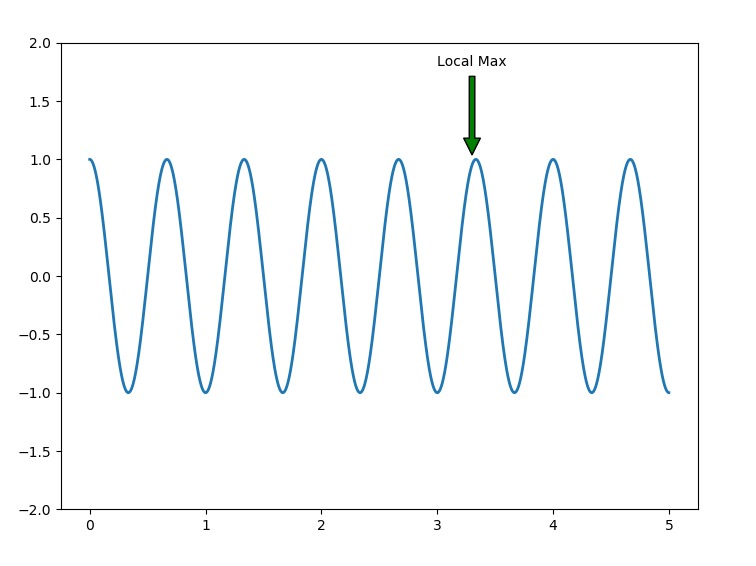
范例1:
# Implementation of matplotlib.pyplot.annotate()
# function
import matplotlib.pyplot as plt
import numpy as np
fig, geeeks = plt.subplots()
t = np.arange(0.0, 5.0, 0.001)
s = np.cos(3 * np.pi * t)
line = geeeks.plot(t, s, lw = 2)
# Annotation
geeeks.annotate('Local Max', xy =(3.3, 1),
xytext =(3, 1.8),
arrowprops = dict(facecolor ='green',
shrink = 0.05),)
geeeks.set_ylim(-2, 2)
# Plot the Annotation in the graph
plt.show()
输出:
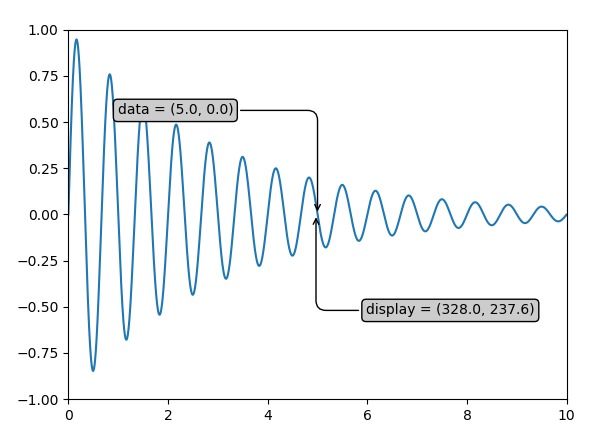
范例2:
# Implementation of matplotlib.pyplot.annotate()
# function
import numpy as np
import matplotlib.pyplot as plt
x = np.arange(0, 10, 0.005)
y = np.exp(-x / 3.) * np.sin(3 * np.pi * x)
fig, ax = plt.subplots()
ax.plot(x, y)
ax.set_xlim(0, 10)
ax.set_ylim(-1, 1)
# Setting up the parameters
xdata, ydata = 5, 0
xdisplay, ydisplay = ax.transData.transform((xdata, ydata))
bbox = dict(boxstyle ="round", fc ="0.8")
arrowprops = dict(
arrowstyle = "->",
connectionstyle = "angle, angleA = 0, angleB = 90,\
rad = 10")
offset = 72
# Annotation
ax.annotate('data = (%.1f, %.1f)'%(xdata, ydata),
(xdata, ydata), xytext =(-2 * offset, offset),
textcoords ='offset points',
bbox = bbox, arrowprops = arrowprops)
disp = ax.annotate('display = (%.1f, %.1f)'%(xdisplay, ydisplay),
(xdisplay, ydisplay), xytext =(0.5 * offset, -offset),
xycoords ='figure pixels',
textcoords ='offset points',
bbox = bbox, arrowprops = arrowprops)
# To display the annotation
plt.show()
输出:


 1405
1405

 被折叠的 条评论
为什么被折叠?
被折叠的 条评论
为什么被折叠?
 到【灌水乐园】发言


