


一、介绍
1、简介
二、原理
Prometheus 的原理可以从架构、数据采集方式、存储机制、查询与告警机制几个方面来理解,它是一种基于 时间序列数据库(TSDB) 的 拉模式(Pull-based)监控系统。
架构核心组件
Prometheus 主要包含以下组件:
Prometheus Server(核心服务)
负责定时从被监控对象拉取指标数据(Pull)。
存储抓取到的数据到本地的时间序列数据库 (TSDB)。
提供 PromQL 查询接口。
Exporters(指标暴露组件)
被监控系统或服务通过 Exporter 暴露指标数据,通常通过 HTTP 端点输出指标(如
/metrics)。例如:
Node Exporter:采集主机 CPU、内存、磁盘等指标。
Spring Boot Actuator:应用指标(HTTP 请求次数、耗时等)。
Alertmanager(告警管理器)
根据 Prometheus 规则触发告警并发送到通知渠道(邮件、Slack、企业微信等)。
Pushgateway(可选)
允许临时性或短生命周期任务主动推送指标到 Prometheus(如批处理任务)。
PromQL(查询语言)
用于对时序数据进行查询、聚合和计算。
数据采集原理(Pull 模型)
Prometheus 主动发起 HTTP 请求,定期访问目标服务的指标端点(默认
/metrics或自定义路径)。每次采集会抓取指标文本内容,并将数据按时间戳记录下来,形成时间序列数据。
特点:
✅ 简单:只需目标服务暴露 HTTP 指标端点
✅ 自动发现:Prometheus 可以通过 Service Discovery 自动发现目标
❌ 适合长生命周期服务,不适合短暂存在的任务(可通过 Pushgateway 解决)
数据模型
Prometheus 数据是多维时间序列,核心概念:
Metric Name(指标名称):如
http_requests_totalLabels(标签):如
{method="GET", status="200"}
→ 通过标签可以区分不同维度的数据。时间戳 + 值:每个时间序列点都有时间戳和数值。
例子:
graphql
CopyEdit
http_requests_total{method="GET", status="200"} 1027 @1677990000 http_requests_total{method="POST", status="500"} 3 @1677990000
存储机制
Prometheus 自带高效的 本地时序数据库(TSDB):
以块(Block)形式存储,每个块包含一段时间范围的压缩时间序列数据。
使用高效的压缩算法(如 Gorilla)。
历史数据可通过 远程存储(Remote Storage) 方案(如 Thanos、Cortex)持久化。
查询与告警
PromQL(Prometheus Query Language) 是用于查询时间序列的语言:
rate(http_requests_total[5m])→ 过去 5 分钟的 QPS 速率
sum by (status) (http_requests_total)→ 按状态码聚合请求数告警规则由 Prometheus 定义,触发后发送到 Alertmanager 处理:
告警可支持去重、抑制、分组等,最终发送到指定渠道(邮件、Slack 等)。
整体工作流程
服务暴露
/metrics端点(或 Exporter 提供端点)。Prometheus 定期拉取指标(Pull)。
数据存入本地 TSDB。
通过 PromQL 查询数据或定义告警规则。
Alertmanager 触发并发送告警。
Grafana 通过 Prometheus 作为数据源进行可视化展示。
Prometheus 的特点
拉模式(Pull):服务端主动抓取指标,易于监控动态服务。
多维度标签:指标灵活聚合。
无外部依赖:Prometheus Server 单体即可运行。
易集成:配合 Grafana、Alertmanager,快速形成监控+告警+可视化方案。
三、使用方法
1、下载安装
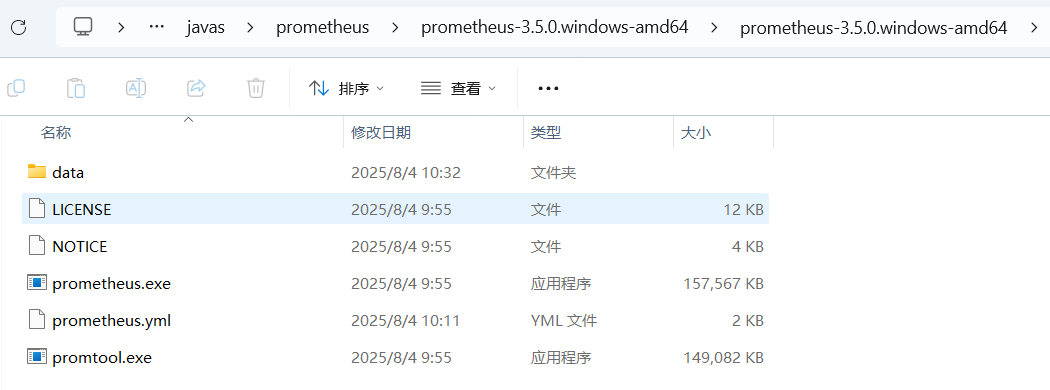
我下载的最后一个
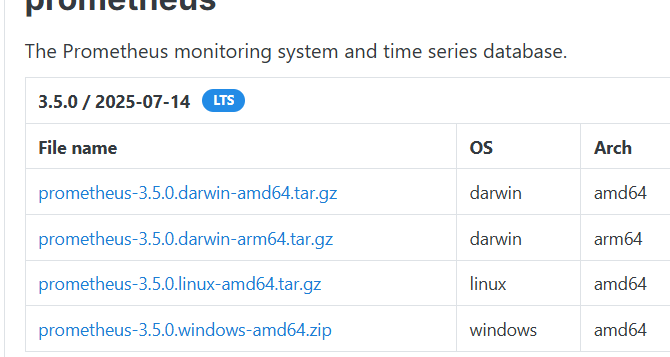
解压后得到
2、修改配置
修改yml文件,如我有一个现有的项目,所以改了以下几个地方
global:
  scrape_interval: 5s


- job_name: "prometheus"
    metrics_path: '/{项目的context-path}/actuator/prometheus'  #取决于你的项目配置


static_configs:
      - targets: ["{项目ip}:{项目端口号}"]   #取决于你项目的server.port
3、启动
在yml所在的目录下进入cmd输入
prometheus --config.file=prometheus.yml4、查询指标
有两种方式,调用prometheus接口查询和后台UI查询。
(1) 接口查询(不够直观)
如我的项目
server.port=3333
server.servlet.context-path=/prometheusDemo
那么访问 http://localhost:3333/prometheusDemo/actuator/prometheus
# HELP tomcat_sessions_expired_sessions_total
# TYPE tomcat_sessions_expired_sessions_total counter
tomcat_sessions_expired_sessions_total 0.0
# HELP jvm_gc_pause_seconds Time spent in GC pause
# TYPE jvm_gc_pause_seconds summary
jvm_gc_pause_seconds_count{action="end of minor GC",cause="G1 Evacuation Pause",gc="G1 Young Generation",} 1.0
jvm_gc_pause_seconds_sum{action="end of minor GC",cause="G1 Evacuation Pause",gc="G1 Young Generation",} 0.01
jvm_gc_pause_seconds_count{action="end of minor GC",cause="CodeCache GC Threshold",gc="G1 Young Generation",} 1.0
jvm_gc_pause_seconds_sum{action="end of minor GC",cause="CodeCache GC Threshold",gc="G1 Young Generation",} 0.005
# HELP jvm_gc_pause_seconds_max Time spent in GC pause
# TYPE jvm_gc_pause_seconds_max gauge
jvm_gc_pause_seconds_max{action="end of minor GC",cause="G1 Evacuation Pause",gc="G1 Young Generation",} 0.0
jvm_gc_pause_seconds_max{action="end of minor GC",cause="CodeCache GC Threshold",gc="G1 Young Generation",} 0.0
# HELP process_uptime_seconds The uptime of the Java virtual machine
# TYPE process_uptime_seconds gauge
process_uptime_seconds 1302.037
# HELP jvm_memory_used_bytes The amount of used memory
# TYPE jvm_memory_used_bytes gauge
jvm_memory_used_bytes{area="heap",id="G1 Survivor Space",} 3809568.0
jvm_memory_used_bytes{area="heap",id="G1 Old Gen",} 1.6277464E7
jvm_memory_used_bytes{area="nonheap",id="Metaspace",} 3.6982992E7
jvm_memory_used_bytes{area="nonheap",id="CodeCache",} 1.3414912E7
jvm_memory_used_bytes{area="heap",id="G1 Eden Space",} 3.7748736E7
jvm_memory_used_bytes{area="nonheap",id="Compressed Class Space",} 5029264.0
# HELP logback_events_total Number of log events that were enabled by the effective log level
# TYPE logback_events_total counter
logback_events_total{level="warn",} 0.0
logback_events_total{level="debug",} 0.0
logback_events_total{level="error",} 0.0
logback_events_total{level="trace",} 0.0
logback_events_total{level="info",} 282.0
# HELP executor_queued_tasks The approximate number of tasks that are queued for execution
# TYPE executor_queued_tasks gauge
executor_queued_tasks{name="applicationTaskExecutor",} 0.0
# HELP executor_queue_remaining_tasks The number of additional elements that this queue can ideally accept without blocking
# TYPE executor_queue_remaining_tasks gauge
executor_queue_remaining_tasks{name="applicationTaskExecutor",} 2.147483647E9
# HELP jvm_threads_peak_threads The peak live thread count since the Java virtual machine started or peak was reset
# TYPE jvm_threads_peak_threads gauge
jvm_threads_peak_threads 29.0
# HELP jvm_threads_started_threads_total The total number of application threads started in the JVM
# TYPE jvm_threads_started_threads_total counter
jvm_threads_started_threads_total 43.0
# HELP jvm_gc_overhead_percent An approximation of the percent of CPU time used by GC activities over the last lookback period or since monitoring began, whichever is shorter, in the range [0..1]
# TYPE jvm_gc_overhead_percent gauge
jvm_gc_overhead_percent 0.0
# HELP jvm_info JVM version info
# TYPE jvm_info gauge
jvm_info{runtime="Java(TM) SE Runtime Environment",vendor="Oracle Corporation",version="21.0.8+12-LTS-250",} 1.0
# HELP jvm_threads_daemon_threads The current number of live daemon threads
# TYPE jvm_threads_daemon_threads gauge
jvm_threads_daemon_threads 20.0
# HELP process_cpu_usage The "recent cpu usage" for the Java Virtual Machine process
# TYPE process_cpu_usage gauge
process_cpu_usage 0.002419461315820144
# HELP executor_pool_size_threads The current number of threads in the pool
# TYPE executor_pool_size_threads gauge
executor_pool_size_threads{name="applicationTaskExecutor",} 0.0
# HELP jvm_gc_memory_promoted_bytes_total Count of positive increases in the size of the old generation memory pool before GC to after GC
# TYPE jvm_gc_memory_promoted_bytes_total counter
jvm_gc_memory_promoted_bytes_total 2434728.0
# HELP jvm_classes_unloaded_classes_total The total number of classes unloaded since the Java virtual machine has started execution
# TYPE jvm_classes_unloaded_classes_total counter
jvm_classes_unloaded_classes_total 126.0
# HELP jvm_threads_live_threads The current number of live threads including both daemon and non-daemon threads
# TYPE jvm_threads_live_threads gauge
jvm_threads_live_threads 24.0
# HELP jvm_gc_live_data_size_bytes Size of long-lived heap memory pool after reclamation
# TYPE jvm_gc_live_data_size_bytes gauge
jvm_gc_live_data_size_bytes 0.0
# HELP jvm_buffer_count_buffers An estimate of the number of buffers in the pool
# TYPE jvm_buffer_count_buffers gauge
jvm_buffer_count_buffers{id="mapped - 'non-volatile memory'",} 0.0
jvm_buffer_count_buffers{id="mapped",} 0.0
jvm_buffer_count_buffers{id="direct",} 10.0
# HELP executor_completed_tasks_total The approximate total number of tasks that have completed execution
# TYPE executor_completed_tasks_total counter
executor_completed_tasks_total{name="applicationTaskExecutor",} 0.0
# HELP jvm_buffer_total_capacity_bytes An estimate of the total capacity of the buffers in this pool
# TYPE jvm_buffer_total_capacity_bytes gauge
jvm_buffer_total_capacity_bytes{id="mapped - 'non-volatile memory'",} 0.0
jvm_buffer_total_capacity_bytes{id="mapped",} 0.0
jvm_buffer_total_capacity_bytes{id="direct",} 81920.0
# HELP jvm_memory_committed_bytes The amount of memory in bytes that is committed for the Java virtual machine to use
# TYPE jvm_memory_committed_bytes gauge
jvm_memory_committed_bytes{area="heap",id="G1 Survivor Space",} 4194304.0
jvm_memory_committed_bytes{area="heap",id="G1 Old Gen",} 3.3554432E7
jvm_memory_committed_bytes{area="nonheap",id="Metaspace",} 3.7814272E7
jvm_memory_committed_bytes{area="nonheap",id="CodeCache",} 1.7825792E7
jvm_memory_committed_bytes{area="heap",id="G1 Eden Space",} 5.4525952E7
jvm_memory_committed_bytes{area="nonheap",id="Compressed Class Space",} 5439488.0
# HELP tomcat_sessions_rejected_sessions_total
# TYPE tomcat_sessions_rejected_sessions_total counter
tomcat_sessions_rejected_sessions_total 0.0
# HELP http_server_requests_active_seconds_max
# TYPE http_server_requests_active_seconds_max gauge
http_server_requests_active_seconds_max{exception="none",method="GET",outcome="SUCCESS",status="200",uri="UNKNOWN",} 0.1297338
# HELP http_server_requests_active_seconds
# TYPE http_server_requests_active_seconds summary
http_server_requests_active_seconds_active_count{exception="none",method="GET",outcome="SUCCESS",status="200",uri="UNKNOWN",} 1.0
http_server_requests_active_seconds_duration_sum{exception="none",method="GET",outcome="SUCCESS",status="200",uri="UNKNOWN",} 0.1297218
# HELP tomcat_sessions_alive_max_seconds
# TYPE tomcat_sessions_alive_max_seconds gauge
tomcat_sessions_alive_max_seconds 0.0
# HELP disk_total_bytes Total space for path
# TYPE disk_total_bytes gauge
disk_total_bytes{path="C:\\mydemo\\security-jwt-demo\\.",} 1.022390956032E12
# HELP disk_free_bytes Usable space for path
# TYPE disk_free_bytes gauge
disk_free_bytes{path="C:\\mydemo\\security-jwt-demo\\.",} 8.20685365248E11
# HELP executor_pool_core_threads The core number of threads for the pool
# TYPE executor_pool_core_threads gauge
executor_pool_core_threads{name="applicationTaskExecutor",} 8.0
# HELP jvm_classes_loaded_classes The number of classes that are currently loaded in the Java virtual machine
# TYPE jvm_classes_loaded_classes gauge
jvm_classes_loaded_classes 8895.0
# HELP application_ready_time_seconds Time taken for the application to be ready to service requests
# TYPE application_ready_time_seconds gauge
application_ready_time_seconds{main_application_class="com.demo.PrometheusApplication",} 2.191
# HELP http_server_requests_seconds
# TYPE http_server_requests_seconds summary
http_server_requests_seconds_count{error="none",exception="none",method="GET",outcome="SUCCESS",status="200",uri="/role/queryByRoleId",} 3.0
http_server_requests_seconds_sum{error="none",exception="none",method="GET",outcome="SUCCESS",status="200",uri="/role/queryByRoleId",} 0.0124431
http_server_requests_seconds_count{error="none",exception="none",method="GET",outcome="SUCCESS",status="200",uri="/actuator/prometheus",} 260.0
http_server_requests_seconds_sum{error="none",exception="none",method="GET",outcome="SUCCESS",status="200",uri="/actuator/prometheus",} 37.4457548
http_server_requests_seconds_count{error="none",exception="none",method="GET",outcome="SUCCESS",status="200",uri="/user/queryByUserId",} 1.0
http_server_requests_seconds_sum{error="none",exception="none",method="GET",outcome="SUCCESS",status="200",uri="/user/queryByUserId",} 0.0367494
http_server_requests_seconds_count{error="none",exception="none",method="GET",outcome="SUCCESS",status="200",uri="/menu/queryByMenuId",} 2.0
http_server_requests_seconds_sum{error="none",exception="none",method="GET",outcome="SUCCESS",status="200",uri="/menu/queryByMenuId",} 0.0102598
http_server_requests_seconds_count{error="none",exception="none",method="GET",outcome="CLIENT_ERROR",status="404",uri="/**",} 2.0
http_server_requests_seconds_sum{error="none",exception="none",method="GET",outcome="CLIENT_ERROR",status="404",uri="/**",} 0.0141608
# HELP http_server_requests_seconds_max
# TYPE http_server_requests_seconds_max gauge
http_server_requests_seconds_max{error="none",exception="none",method="GET",outcome="SUCCESS",status="200",uri="/role/queryByRoleId",} 0.0
http_server_requests_seconds_max{error="none",exception="none",method="GET",outcome="SUCCESS",status="200",uri="/actuator/prometheus",} 0.2507405
http_server_requests_seconds_max{error="none",exception="none",method="GET",outcome="SUCCESS",status="200",uri="/user/queryByUserId",} 0.0
http_server_requests_seconds_max{error="none",exception="none",method="GET",outcome="SUCCESS",status="200",uri="/menu/queryByMenuId",} 0.0
http_server_requests_seconds_max{error="none",exception="none",method="GET",outcome="CLIENT_ERROR",status="404",uri="/**",} 0.0091089
# HELP system_cpu_count The number of processors available to the Java virtual machine
# TYPE system_cpu_count gauge
system_cpu_count 20.0
# HELP tomcat_sessions_active_current_sessions
# TYPE tomcat_sessions_active_current_sessions gauge
tomcat_sessions_active_current_sessions 0.0
# HELP jvm_gc_memory_allocated_bytes_total Incremented for an increase in the size of the (young) heap memory pool after one GC to before the next
# TYPE jvm_gc_memory_allocated_bytes_total counter
jvm_gc_memory_allocated_bytes_total 8.8080384E7
# HELP executor_active_threads The approximate number of threads that are actively executing tasks
# TYPE executor_active_threads gauge
executor_active_threads{name="applicationTaskExecutor",} 0.0
# HELP system_cpu_usage The "recent cpu usage" of the system the application is running in
# TYPE system_cpu_usage gauge
system_cpu_usage 0.15533031890255866
# HELP tomcat_sessions_active_max_sessions
# TYPE tomcat_sessions_active_max_sessions gauge
tomcat_sessions_active_max_sessions 0.0
# HELP jvm_compilation_time_ms_total The approximate accumulated elapsed time spent in compilation
# TYPE jvm_compilation_time_ms_total counter
jvm_compilation_time_ms_total{compiler="HotSpot 64-Bit Tiered Compilers",} 2313.0
# HELP jvm_gc_max_data_size_bytes Max size of long-lived heap memory pool
# TYPE jvm_gc_max_data_size_bytes gauge
jvm_gc_max_data_size_bytes 8.501854208E9
# HELP jvm_memory_max_bytes The maximum amount of memory in bytes that can be used for memory management
# TYPE jvm_memory_max_bytes gauge
jvm_memory_max_bytes{area="heap",id="G1 Survivor Space",} -1.0
jvm_memory_max_bytes{area="heap",id="G1 Old Gen",} 8.501854208E9
jvm_memory_max_bytes{area="nonheap",id="Metaspace",} -1.0
jvm_memory_max_bytes{area="nonheap",id="CodeCache",} 5.0331648E7
jvm_memory_max_bytes{area="heap",id="G1 Eden Space",} -1.0
jvm_memory_max_bytes{area="nonheap",id="Compressed Class Space",} 1.073741824E9
# HELP process_start_time_seconds Start time of the process since unix epoch.
# TYPE process_start_time_seconds gauge
process_start_time_seconds 1.754286073695E9
# HELP api_request_total Total number of API requests
# TYPE api_request_total counter
api_request_total{method="GET",status="404",uri="/prometheusDemo/test",} 1.0
api_request_total{method="GET",status="200",uri="/prometheusDemo/role/queryByRoleId",} 3.0
api_request_total{method="GET",status="404",uri="/prometheusDemo/",} 1.0
api_request_total{method="GET",status="200",uri="/prometheusDemo/user/queryByUserId",} 1.0
api_request_total{method="GET",status="200",uri="/prometheusDemo/menu/queryByMenuId",} 2.0
# HELP jvm_threads_states_threads The current number of threads
# TYPE jvm_threads_states_threads gauge
jvm_threads_states_threads{state="runnable",} 9.0
jvm_threads_states_threads{state="blocked",} 0.0
jvm_threads_states_threads{state="waiting",} 12.0
jvm_threads_states_threads{state="timed-waiting",} 3.0
jvm_threads_states_threads{state="new",} 0.0
jvm_threads_states_threads{state="terminated",} 0.0
# HELP api_requests_duration_seconds_max API request duration in seconds
# TYPE api_requests_duration_seconds_max gauge
api_requests_duration_seconds_max{method="GET",status="404",uri="/prometheusDemo/test",} 0.0036122
api_requests_duration_seconds_max{method="GET",status="200",uri="/prometheusDemo/role/queryByRoleId",} 0.0
api_requests_duration_seconds_max{method="GET",status="404",uri="/prometheusDemo/",} 0.0075499
api_requests_duration_seconds_max{method="GET",status="200",uri="/prometheusDemo/user/queryByUserId",} 0.0
api_requests_duration_seconds_max{method="GET",status="200",uri="/prometheusDemo/menu/queryByMenuId",} 0.0
# HELP api_requests_duration_seconds API request duration in seconds
# TYPE api_requests_duration_seconds summary
api_requests_duration_seconds_count{method="GET",status="404",uri="/prometheusDemo/test",} 1.0
api_requests_duration_seconds_sum{method="GET",status="404",uri="/prometheusDemo/test",} 0.0036122
api_requests_duration_seconds_count{method="GET",status="200",uri="/prometheusDemo/role/queryByRoleId",} 3.0
api_requests_duration_seconds_sum{method="GET",status="200",uri="/prometheusDemo/role/queryByRoleId",} 0.0062313
api_requests_duration_seconds_count{method="GET",status="404",uri="/prometheusDemo/",} 1.0
api_requests_duration_seconds_sum{method="GET",status="404",uri="/prometheusDemo/",} 0.0075499
api_requests_duration_seconds_count{method="GET",status="200",uri="/prometheusDemo/user/queryByUserId",} 1.0
api_requests_duration_seconds_sum{method="GET",status="200",uri="/prometheusDemo/user/queryByUserId",} 0.0104183
api_requests_duration_seconds_count{method="GET",status="200",uri="/prometheusDemo/menu/queryByMenuId",} 2.0
api_requests_duration_seconds_sum{method="GET",status="200",uri="/prometheusDemo/menu/queryByMenuId",} 0.0059893
# HELP tomcat_sessions_created_sessions_total
# TYPE tomcat_sessions_created_sessions_total counter
tomcat_sessions_created_sessions_total 0.0
# HELP jvm_memory_usage_after_gc_percent The percentage of long-lived heap pool used after the last GC event, in the range [0..1]
# TYPE jvm_memory_usage_after_gc_percent gauge
jvm_memory_usage_after_gc_percent{area="heap",pool="long-lived",} 0.0019145781145815668
# HELP executor_pool_max_threads The maximum allowed number of threads in the pool
# TYPE executor_pool_max_threads gauge
executor_pool_max_threads{name="applicationTaskExecutor",} 2.147483647E9
# HELP application_started_time_seconds Time taken to start the application
# TYPE application_started_time_seconds gauge
application_started_time_seconds{main_application_class="com.demo.PrometheusApplication",} 2.184
# HELP jvm_gc_concurrent_phase_time_seconds Time spent in concurrent phase
# TYPE jvm_gc_concurrent_phase_time_seconds summary
jvm_gc_concurrent_phase_time_seconds_count{action="end of concurrent GC pause",cause="No GC",gc="G1 Concurrent GC",} 2.0
jvm_gc_concurrent_phase_time_seconds_sum{action="end of concurrent GC pause",cause="No GC",gc="G1 Concurrent GC",} 0.007
# HELP jvm_gc_concurrent_phase_time_seconds_max Time spent in concurrent phase
# TYPE jvm_gc_concurrent_phase_time_seconds_max gauge
jvm_gc_concurrent_phase_time_seconds_max{action="end of concurrent GC pause",cause="No GC",gc="G1 Concurrent GC",} 0.0
# HELP jvm_buffer_memory_used_bytes An estimate of the memory that the Java virtual machine is using for this buffer pool
# TYPE jvm_buffer_memory_used_bytes gauge
jvm_buffer_memory_used_bytes{id="mapped - 'non-volatile memory'",} 0.0
jvm_buffer_memory_used_bytes{id="mapped",} 0.0
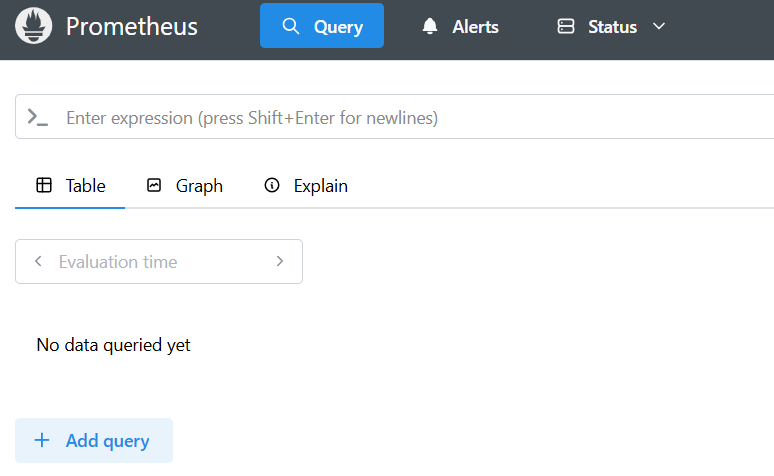
jvm_buffer_memory_used_bytes{id="direct",} 81920.0(2) UI查询(推荐)
访问http://localhost:9090/ 即可进入UI页面
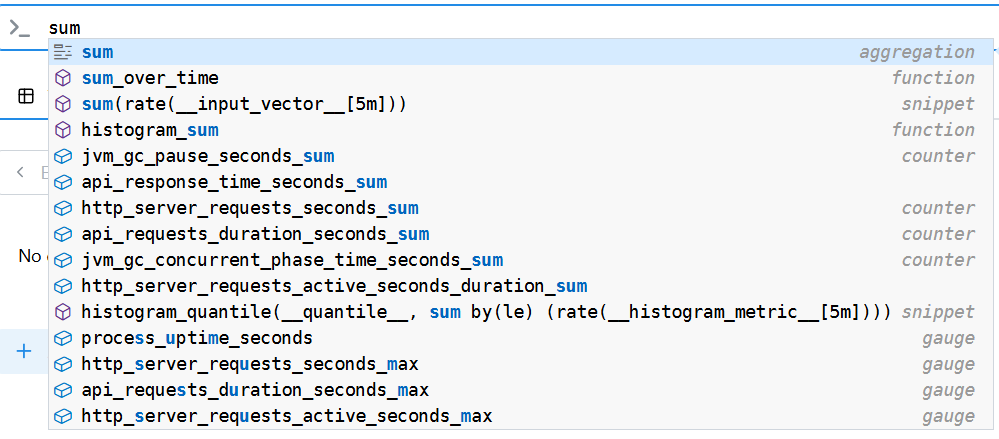
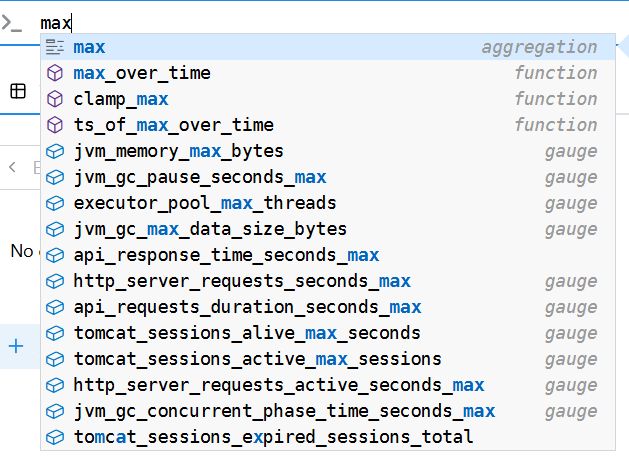
5、常用查询指标
自带很多统计指标,如我输入sum、max等统计方法可以出来很多关键字
6、简单demo
(1)pom
 <parent>
        <groupId>org.springframework.boot</groupId>
        <artifactId>spring-boot-starter-parent</artifactId>
        <version>3.2.4</version>
        <relativePath/>
    </parent>

    <dependencies>
        <!-- Web -->
        <dependency>
            <groupId>org.springframework.boot</groupId>
            <artifactId>spring-boot-starter-web</artifactId>
        </dependency>

        <!-- Actuator -->
        <dependency>
            <groupId>org.springframework.boot</groupId>
            <artifactId>spring-boot-starter-actuator</artifactId>
        </dependency>

        <!-- Prometheus Registry -->
        <dependency>
            <groupId>io.micrometer</groupId>
            <artifactId>micrometer-registry-prometheus</artifactId>
        </dependency>

        <dependency>
            <groupId>org.projectlombok</groupId>
            <artifactId>lombok</artifactId>
        </dependency>
    </dependencies>

    <build>
        <plugins>
            <plugin>
                <groupId>org.springframework.boot</groupId>
                <artifactId>spring-boot-maven-plugin</artifactId>
            </plugin>
        </plugins>
    </build>
(2)配置
server.port=3333
server.servlet.context-path=/prometheusDemo

management.endpoints.web.exposure.include=health,info,prometheus
management.endpoint.prometheus.enabled=true
(3)指标上报
package com.demo.controller;

import io.micrometer.core.instrument.MeterRegistry;
import org.springframework.beans.factory.annotation.Autowired;
import org.springframework.web.bind.annotation.GetMapping;
import org.springframework.web.bind.annotation.RequestMapping;
import org.springframework.web.bind.annotation.RestController;

@RestController
@RequestMapping("/user")
public class UserController {

    @Autowired
    private MeterRegistry meterRegistry;


    @GetMapping("/test")
    public String test(String userId) {
        meterRegistry.counter("user_test", "userId", userId).increment();
        return "Hello"+userId;
    }

    @GetMapping("/test1")
    public String test1(String userId) {
        meterRegistry.counter("user_test_1", "userId", userId).increment();
        return "Hello_1:"+userId;
    }

}
(4)prometheus配置修改
global:
  scrape_interval: 5 #修改处一

config.

    metrics_path: '/prometheusDemo/actuator/prometheus'    #修改处二


    static_configs:
      - targets: ["localhost:3333"]  #修改处三
(5)测试
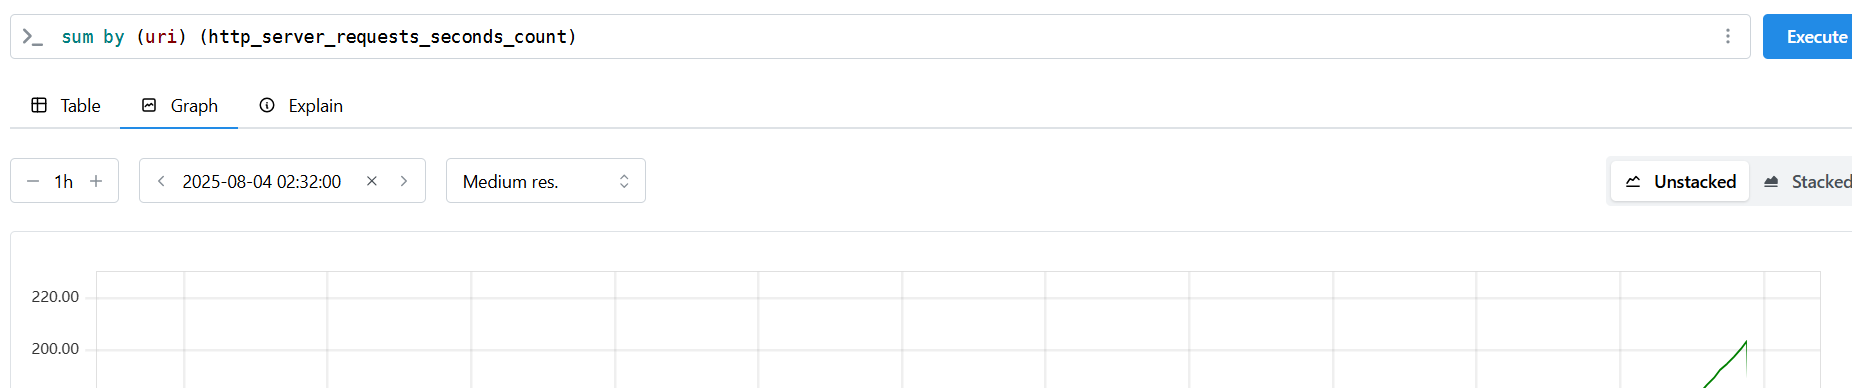
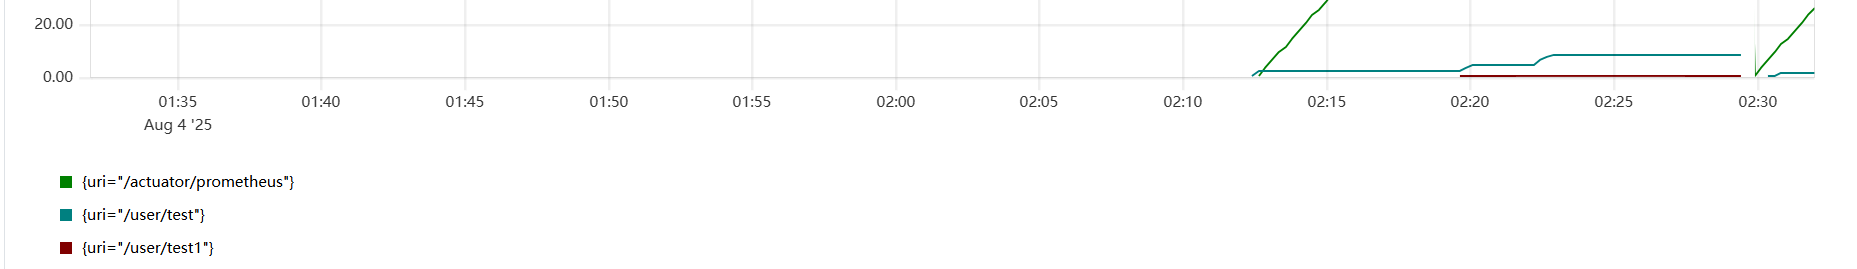
sum by (uri) (http_server_requests_seconds_count)
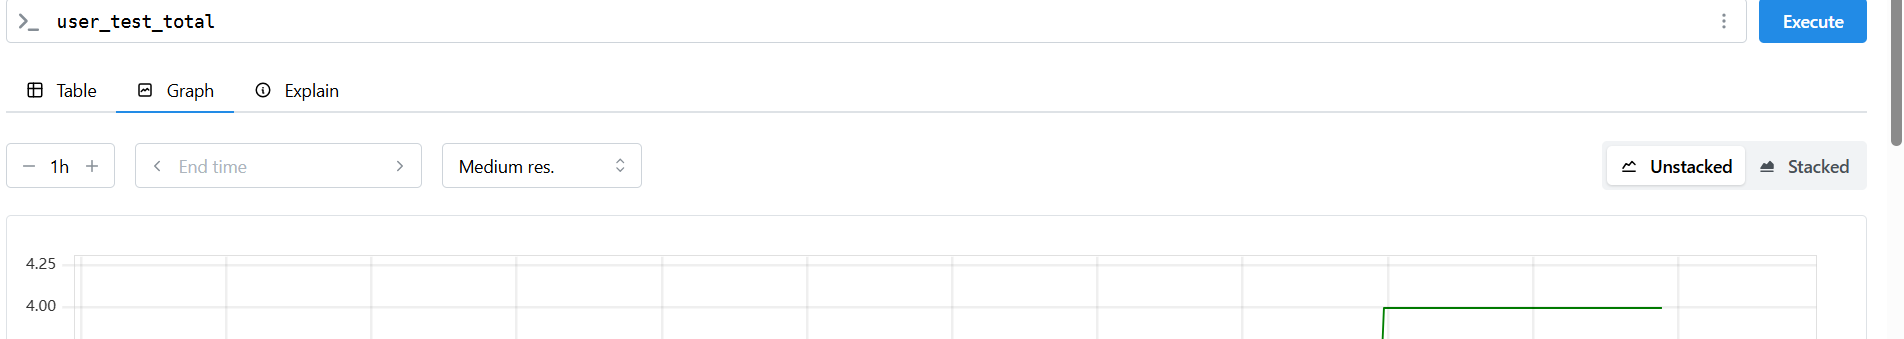
测试 user_test_total
测试 topk(2, sum by (uri) (http_server_requests_seconds_count))
四、重启问题
重启Prometheus数据不会丢失;
重启项目,Prometheus的历史数据也不会丢失,但是看板的数据是重新计算的。
1、Counter重置
原因
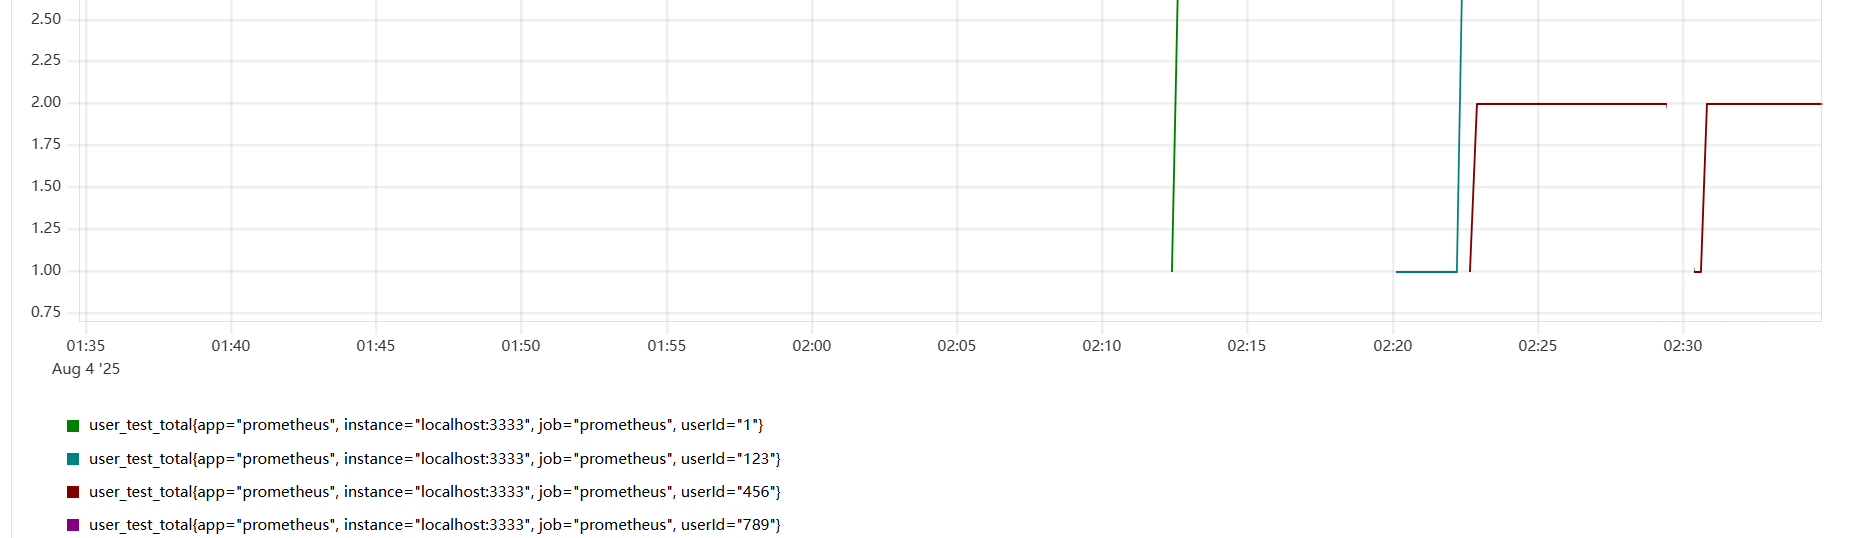
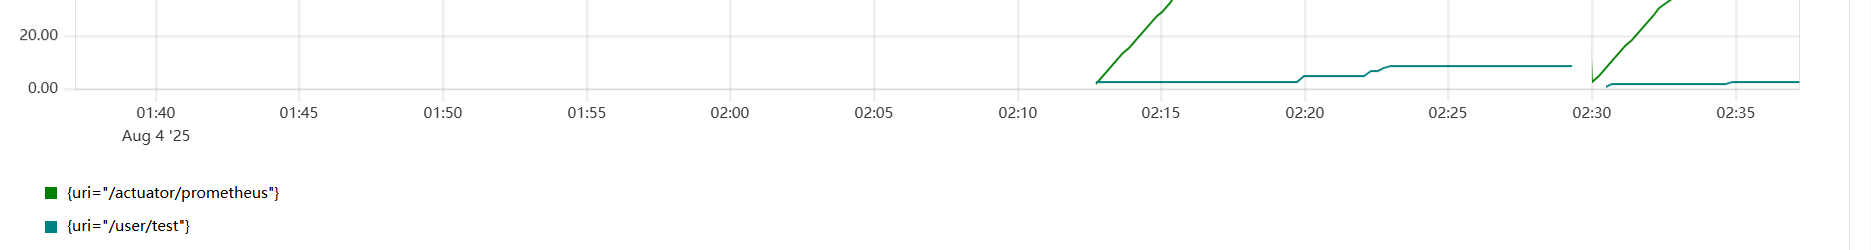
Counter 是 Micrometer + Prometheus 组合中的应用内指标,计数器值保存在 应用进程内存 中,应用重启,所有内存中的指标值会被清空。所以Prometheus 重新抓取指标后,新的计数器会从 0 开始。如下面我重启了一次服务,再次访问count总数又从1开始了

即使把采集时间拉长(如改成15s)在15s范围内重启服务并访问接口,仍然会重置
Prometheus 的行为
Prometheus 是拉模式,会定期采集指标(例如 /actuator/prometheus)。当应用重启后,Prometheus 会看到计数器值从 0 重新开始。在查询时,Prometheus 通过时间序列的 rate() 或 increase() 等函数计算增量,因此不会受重启归零的影响。
2、Gauge重置
Gauge 和 Counter 在 Micrometer(Spring Boot 监控中使用的指标库)中的行为类似,它们的值在应用重启后同样会被重置。
Gauge 的特点
-
Gauge 表示一个可以上下浮动的值(例如内存占用、线程数量、队列长度)。
-
它不是累加的,而是瞬时值(瞬时快照)。
-
Gauge 本质上是通过回调函数获取当前值,Prometheus 每次抓取
/actuator/prometheus时动态计算。
Gauge 在重启时的表现
-
Gauge 本身不会存储历史值,每次应用启动后重新注册 Gauge。
-
因为 Gauge 是“读值”型指标,应用重启后 Prometheus 会继续采集当前的瞬时值。
-
所以 Gauge 不存在累积问题,但应用重启后 Gauge 的初始值取决于代码中的状态或回调的返回值。
3、重启后指标恢复的几种方案
(1)接受重置(推荐用于大多数场景)
// 重启后自然重新统计,这是最常见的做法
// 最大值从新的调用中重新产生
// 平均值基于新的Counter数据计算
(2)定期持久化到数据库
// 定期将MetricsBean的状态保存到数据库
// 应用启动时从数据库恢复历史最大值
@Scheduled(fixedRate = 60000) // 每分钟保存一次
public void persistMetrics() {
    for (RepositoryMetricsBean bean : methodMetricsBeans.values()) {
        // 保存到数据库
        saveMetricsToDatabase(bean);
    }
}
(3)调用Prometheus API恢复
// 启动时调用Prometheus Query API获取历史最大值
// GET /api/v1/query?query=max_over_time(repository_method_list_elements_max[24h])
private void recoverMaxValueFromPrometheus(String className, String methodName) {
    String query = String.format(
        "max_over_time(repository_method_list_elements_max{class=\"%s\",method=\"%s\"}[24h])",
        className, methodName
    );
    // 调用Prometheus API查询历史最大值
}
生产环境最佳实践
短期指标(分钟级/小时级):接受重启重置
长期趋势(天级/周级):使用Prometheus历史数据查询
关键业务指标:考虑持久化到数据库
五、Grafana图表
prometheus可以自定义上报数据,也可以自定义统计方法(如最大、平均等)查看指标,但是图表不是很直观,一个query只能查看一个统计,多个query需要下拉很长才能看到下面的,还容易误删query。
1、介绍
Grafana 是一个开源的可视化与监控平台,主要用于展示和分析监控数据。它可以连接多个数据源(如 Prometheus、Elasticsearch、InfluxDB、MySQL 等),并提供可交互的仪表盘、图表和告警功能。
2、下载安装
官方地址:https://grafana.com/grafana/download
安装完成后,Grafana 会自动作为服务启动。默认服务地址http://localhost:3000
MSI安装报错:Verify that you have sufficient privileges to start system services.解决方法:
右键 MSI 安装包 → "以管理员身份运行"。
Grafana 安装时会注册为 Windows 服务,安装需要以下权限:
Log on as a service(以服务身份登录)权限。
可在 本地安全策略中检查:
Win + R→ 输入secpol.msc打开 本地策略 → 用户权限分配
确认 "作为服务登录" (Log on as a service) 中包含当前用户。
比较麻烦,建议
下载 Grafana ZIP 免安装版
解压后进入
bin目录:
运行grafana-server.exe访问
http://localhost:3000(无需服务安装即可使用)。如果需要后台服务,可手动注册:
grafana-server.exe --service install net start grafana
3、配置 Prometheus 数据源
-
登录 Grafana (
http://localhost:3000) -
进入 Configuration → Data Sources → Add data source
-
选择 Prometheus
-
填写 URL(例如
http://localhost:9090) -
点击 Save & Test 确认连接成功。


 628
628

 被折叠的 条评论
为什么被折叠?
被折叠的 条评论
为什么被折叠?
 到【灌水乐园】发言


