


一.四种分割
一、人工阈值分割:最直观的"二分法"
# 导入OpenCV和Matplotlib库
import cv2
import matplotlib.pyplot as plt
# 设置中文字体(解决中文显示问题)
plt.rcParams['font.sans-serif'] = ['SimHei']
# 读取灰度图像(第二个参数0表示灰度模式)
img = cv2.imread('008.bmp', 0)
# 应用固定阈值分割(130为阈值,255为最大值,THRESH_BINARY为二值化模式)
_, img_b = cv2.threshold(img, 130, 255, cv2.THRESH_BINARY)
# 创建1x3的子图布局
plt.subplot(131)
plt.imshow(img, 'gray') # 显示原图
plt.title('原图')
plt.axis('off') # 关闭坐标轴
plt.subplot(132)
# 计算灰度直方图参数:
# [img]:输入图像(需列表包裹)
# [0]:通道索引(灰度图用0)
# None:不使用掩膜
# 256:直方图区间数
# [0,255]:像素值范围
hist = cv2.calcHist([img], [0], None, [256], [0,255])
plt.plot(hist)
plt.title('灰度直方图')
plt.subplot(133)
plt.imshow(img_b, 'gray') # 显示二值化结果
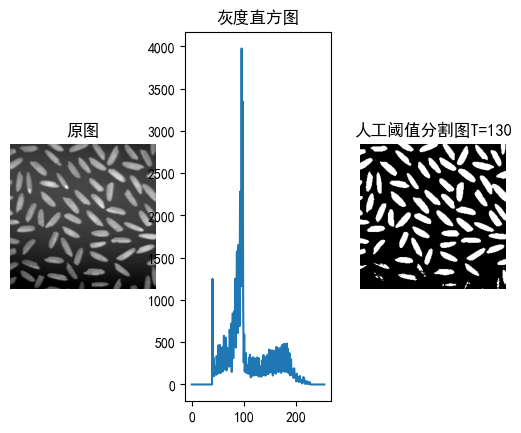
plt.title('人工阈值分割图T=130')
plt.axis('off')
plt.show() # 显示所有子图
就像用剪刀裁剪照片,我们手动设置阈值T=130:
- 像素值≥130 → 变成纯白(255)
- 像素值<130 → 变成纯黑(0)
关键原理:
- 灰度直方图是像素的"人口普查",横轴是0-255的灰度值,纵轴是该灰度出现的次数
- 选择双峰之间的波谷作为阈值,就像在山谷处切开两座山峰
二、双峰阈值法:让计算机自己找剪刀
import numpy as np
import matplotlib.pyplot as plt
plt.rcParams['font.sans-serif'] = ['SimHei']
# 读取图像
img = cv2.imread('007.bmp', 0)
plt.figure(figsize=(15, 5)) # 设置画布尺寸
# 显示原图
plt.subplot(131)
plt.imshow(img, 'gray')
plt.title('原图')
plt.axis('off')
# 直方图计算
hist = cv2.calcHist([img], [0], None, [256], [0, 256])
n = hist.ravel() # 将二维直方图数据展平为一维数组
# 主峰检测
l_ma = np.where(n == np.max(n)) # 找到直方图最大值位置
f1 = l_ma[0][0] # 提取主峰位置(第一个最大值)
# 次峰检测(基于加权平方距离)
temp = 0
f2 = 0
for i in range(256):
# 计算距离主峰的加权平方距离(加强远离主峰区域的权重)
temp1 = np.power(i - f1, 2) * n[i]
if temp1 > temp:
temp = temp1
f2 = i # 更新次峰位置
# 确保f1 < f2
if f1 > f2:
f1, f2 = f2, f1
# 寻找谷底(两峰之间的最小值)
l_mi = np.where(n[f1:f2] == np.min(n[f1:f2]))
T = f1 + l_mi[0][0] # 计算实际阈值位置
# 应用阈值分割
_, img_b = cv2.threshold(img, T, 255, cv2.THRESH_BINARY)
# 可视化结果
plt.subplot(132)
plt.imshow(img_b, 'gray')
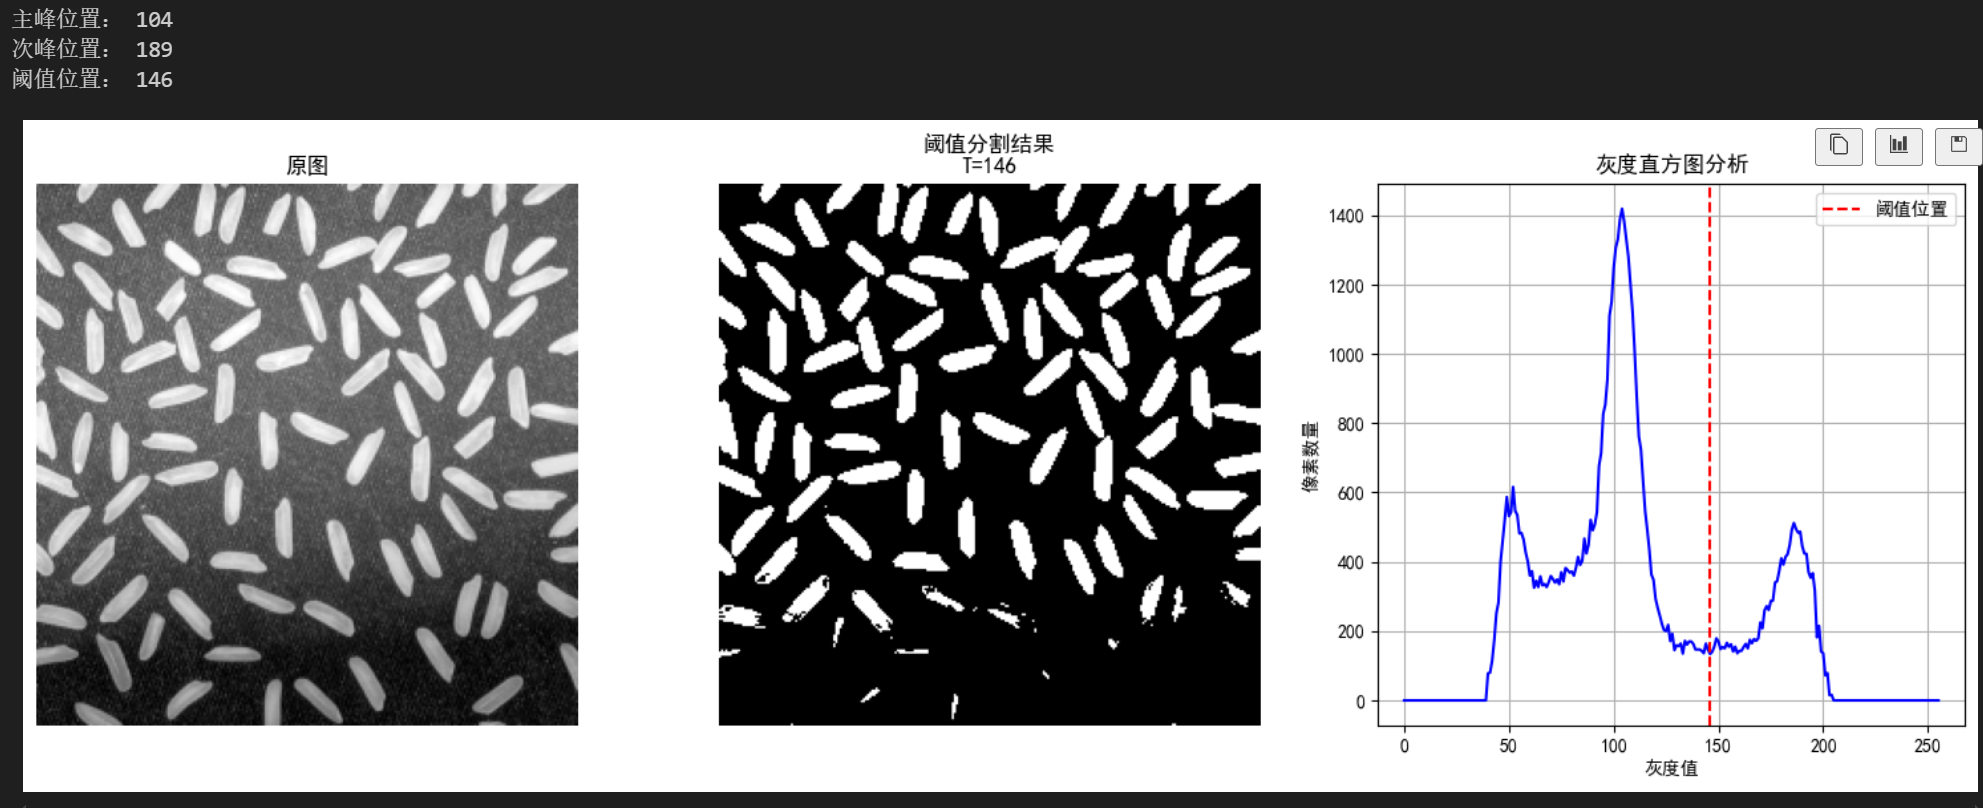
plt.title('阈值分割结果\nT={}'.format(T))
plt.axis('off')
# 直方图分析可视化
plt.subplot(133)
plt.plot(hist, color='blue')
plt.axvline(x=T, color='red', linestyle='--', label='阈值位置') # 绘制阈值线
plt.title('灰度直方图分析')
plt.xlabel('灰度值')
plt.ylabel('像素数量')
plt.legend()
plt.grid(True)
plt.tight_layout() # 自动调整子图间距
plt.show()
算法三步走:
- 找到直方图最高峰(主峰)
- 计算每个灰度的"影响力"(距离²×像素数),找到次峰
- 在两峰之间寻找最低点作为阈值
适合场景:证件照、扫描文档等背景与前景对比明显的图像
三、迭代阈值法:智能逼近的猜数游戏
import cv2
import numpy as np
from matplotlib import pyplot as plt
plt.rcParams['font.sans-serif'] = ['SimHei']
# 读取图像
img = cv2.imread('008.bmp', 0)
# 初始阈值设为图像均值
T = int(np.mean(img))
# 迭代优化过程
while True:
m1 = np.mean(img[img >= T]) # 高于阈值区域的均值
m2 = np.mean(img[img < T]) # 低于阈值区域的均值
new_T = int((m1 + m2) / 2) # 计算新阈值
# 终止条件:阈值变化小于20
if abs(new_T - T) < 20:
break
else:
T = new_T # 更新阈值
# 应用最终阈值
_, img_b = cv2.threshold(img, T, 255, cv2.THRESH_BINARY)
# 结果可视化
plt.subplot(121)
plt.imshow(img, 'gray')
plt.title('原图')
plt.axis('off')
plt.subplot(122)
plt.imshow(img_b, 'gray')
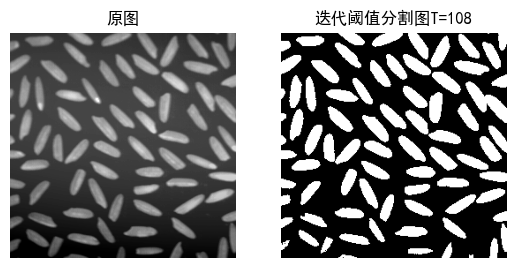
plt.title('迭代阈值分割图T=' + '{:d}'.format(T))
plt.axis('off')
plt.show()
就像玩"猜价格"游戏:
- 初始猜测:全图平均灰度
- 根据当前阈值划分的两个区域重新计算平均灰度
- 用新平均值更新阈值,直到变化量<20
算法优势:自适应调整,无需预设阈值,适合光照不均匀的图像
四、Otsu算法:数学家的最优解
import cv2
import numpy as np
from matplotlib import pyplot as plt
plt.rcParams['font.sans-serif'] = ['SimHei']
img = cv2.imread('008.bmp', 0)
t = 0 # 存储最大类间方差
T = 0 # 最佳阈值
# 遍历所有可能的阈值
for i in range(256):
# 计算两个区域的均值
mean1 = np.mean(img[img < i]) if np.any(img < i) else 0
mean2 = np.mean(img[img >= i]) if np.any(img >= i) else 0
# 计算两个区域的权重(概率)
w1 = np.sum(img < i) / np.size(img)
w2 = np.sum(img >= i) / np.size(img)
# 计算类间方差
tem = w1 * w2 * np.power((mean1 - mean2), 2)
# 更新最大值记录
if tem > t:
T = i
t = tem
# 自实现结果
_, img_b = cv2.threshold(img, T, 255, cv2.THRESH_BINARY)
# OpenCV内置Otsu算法
T1, img_b1 = cv2.threshold(img, 0, 255, cv2.THRESH_BINARY + cv2.THRESH_OTSU)
# 对比可视化
plt.subplot(131)
plt.imshow(img, 'gray')
plt.title('原图')
plt.axis('off')
plt.subplot(132)
plt.imshow(img_b, 'gray')
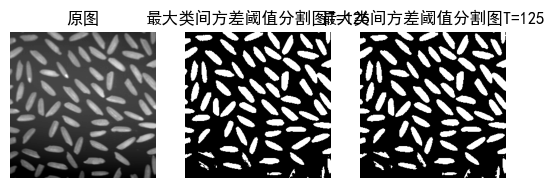
plt.title('自实现Otsu\nT={:d}'.format(T))
plt.axis('off')
plt.subplot(133)
plt.imshow(img_b1, 'gray')
plt.title('OpenCV Otsu\nT={:d}'.format(int(T1)))
plt.axis('off')
plt.show()
大津展之教授提出的经典方法:
- 把图像分为前景/背景两类
- 最大化类间方差:让两类差异尽可能大
- 数学本质:寻找最佳分类边界
对比实验:自实现Otsu与OpenCV内置函数结果基本一致,验证了算法正确性
五.方法对比表
| 方法 | 优点 | 缺点 | 适用场景 |
|---|---|---|---|
| 人工阈值 | 简单直观 | 依赖经验 | 快速原型验证 |
| 双峰法 | 自动寻找阈值 | 需明显双峰 | 高对比度图像 |
| 迭代法 | 自适应迭代 | 可能陷入局部最优 | 光照不均匀图像 |
| Otsu | 全自动最优解 | 计算量较大 | 通用场景 |
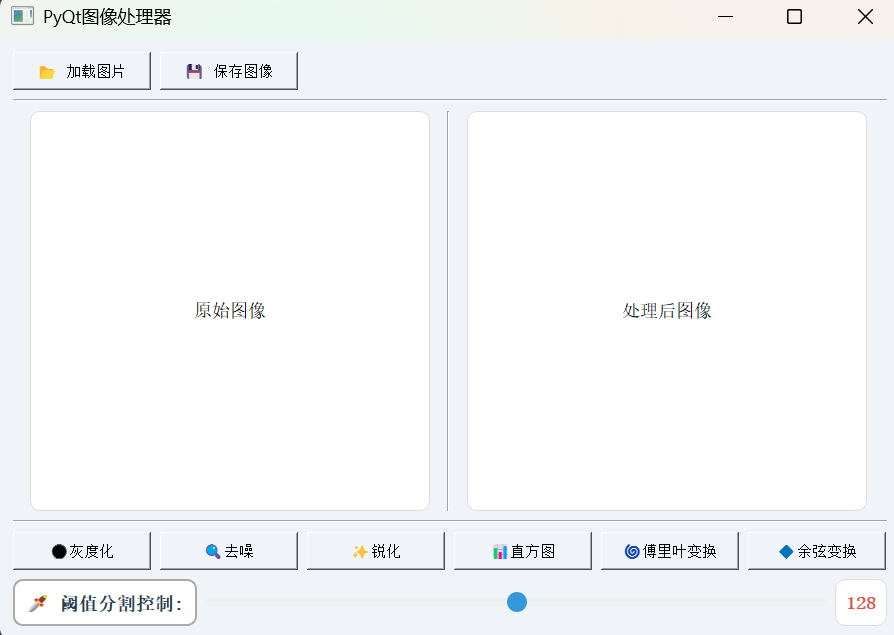
二.为图像处理工具添加交互式阈值分割功能——PyQt5实战指南
一、功能升级对比
原版工具已具备基础的图像处理功能,但缺乏交互性。通过添加阈值控制功能,我们实现了:
- 实时滑动条调节(0-255)
- 动态预览分割效果
- 即时的数值反馈
- 非破坏性操作(原图保留)
二、关键代码实现解析
1. 界面元素添加
在__init__方法中添加以下布局代码:
# =============== 新增阈值控制界面 =============== #
threshold_layout = QHBoxLayout()

# 阈值标签
threshold_title = QLabel("🗡️ 阈值分割控制:")
threshold_title.setStyleSheet("font-weight: bold; color: #2c3e50;")

# 滑动条组件
self.threshold_slider = QSlider(Qt.Horizontal)
self.threshold_slider.setRange(0, 255)  # 设置有效范围
self.threshold_slider.setValue(128)     # 初始值
self.threshold_slider.setTickInterval(10)  # 刻度间隔

# 数值显示标签
self.threshold_value = QLabel("128")
self.threshold_value.setStyleSheet("color: #e74c3c; font-weight: bold;")

# 信号绑定
self.threshold_slider.valueChanged.connect(self.update_threshold)

# 组件组装
threshold_layout.addWidget(threshold_title)
threshold_layout.addWidget(self.threshold_slider)
threshold_layout.addWidget(self.threshold_value)
main_layout.addLayout(threshold_layout)
2. 核心处理逻辑
新增update_threshold方法实现实时更新:
def update_threshold(self, value):
    """实时更新阈值分割结果"""
    # 数值显示更新
    self.threshold_value.setText(str(value))

    if self.image_data['original'] is None:
        return

    # 图像预处理
    img = self.image_data['original'].copy()
    gray = cv2.cvtColor(img, cv2.COLOR_BGR2GRAY)

    # OpenCV阈值分割
    _, thresh = cv2.threshold(gray, value, 255, cv2.THRESH_BINARY)

    # 格式转换(单通道转三通道)
    thresh_bgr = cv2.cvtColor(thresh, cv2.COLOR_GRAY2BGR)

    # 更新显示
    self.image_data['processed'] = thresh_bgr
    self.show_image(thresh_bgr, self.processed_label)
三、技术要点详解
1. 信号与槽机制
PyQt5的核心通信机制:
self.threshold_slider.valueChanged.connect(self.update_threshold)
- 当滑动条值改变时自动触发update_threshold
- 传递当前值作为参数
2. 图像格式转换
OpenCV与PyQt的格式差异处理:
# 单通道转三通道显示
if len(img.shape) == 2:
    rgb = cv2.cvtColor(img, cv2.COLOR_GRAY2RGB)
else:
    rgb = cv2.cvtColor(img, cv2.COLOR_BGR2RGB)
3. 非破坏性处理
保持原始图像完整性的技巧:
img = self.image_data['original'].copy()  # 创建副本
gray = cv2.cvtColor(img, cv2.COLOR_BGR2GRAY)  # 转换副本
四、界面优化技巧
/* 滑动条轨道 */
QSlider::groove:horizontal {
    height: 8px;
    background: #ecf0f1;
    border-radius: 4px;
}

/* 滑动条手柄 */
QSlider::handle:horizontal {
    width: 20px;
    margin: -6px 0;
    background: #3498db;
    border-radius: 10px;
}
# 保持显示区域比例
label.setPixmap(QPixmap.fromImage(q_img).scaled(
    350, 350, Qt.AspectRatioMode.KeepAspectRatio
))
五、功能扩展方向
- 双阈值控制:添加第二个滑动条实现区间阈值
- 自适应阈值:增加自动计算阈值按钮
- 历史记录:保存不同阈值效果对比
- ROI选择:局部区域阈值调节
# 伪代码示例:双阈值控制
self.lower_slider = QSlider(Qt.Horizontal)
self.upper_slider = QSlider(Qt.Horizontal)
_, thresh = cv2.threshold(gray, lower, upper, cv2.THRESH_BINARY)
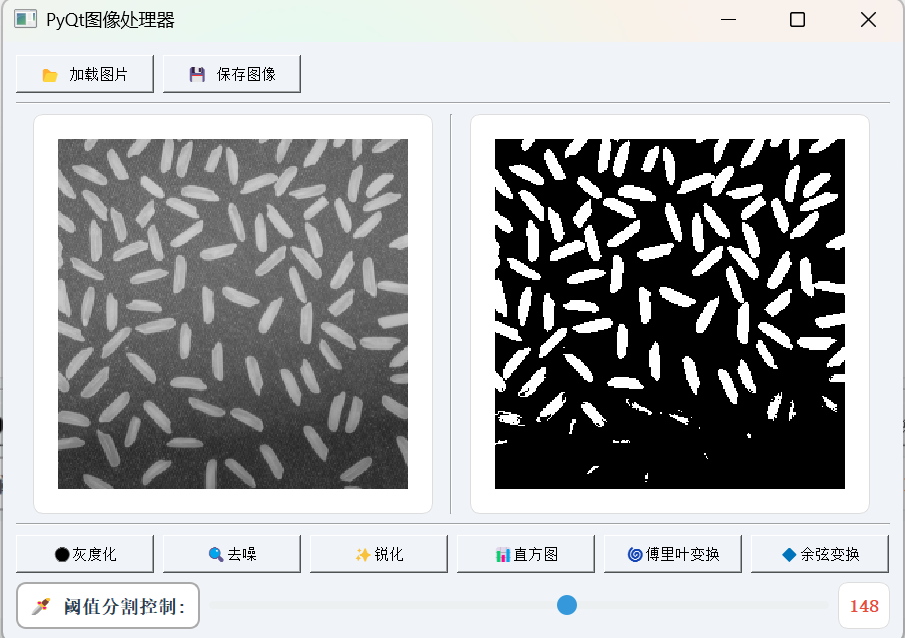
六.成果展示
# 导入必要的模块
import sys
import cv2
import numpy as np
from PyQt5.QtWidgets import (
    QApplication, QMainWindow, QWidget, QLabel, QPushButton,
    QFileDialog, QMessageBox, QVBoxLayout, QHBoxLayout, QFrame, QSlider
)
from PyQt5.QtGui import QPixmap, QImage
from PyQt5.QtCore import Qt
# 使用以下3行语句,设置全局参数,保证中文和负号能够被正确显示
import matplotlib.pyplot as plt
plt.rcParams['font.sans-serif'] = ['SimHei'] # 使用黑体
plt.rcParams['axes.unicode_minus'] = False # 解决负号显示问题

class ImageProcessor(QMainWindow):
    """主窗口类,负责图像处理界面的创建和逻辑处理"""
    def __init__(self):
        super().__init__()
        self.setWindowTitle("PyQt图像处理器")  # 设置窗口标题
        self.resize(900, 600)  # 设置窗口大小

        # 存储图像数据的字典
        self.image_data = {
            'original': None,   # 原始图像
            'processed': None   # 处理后的图像
        }

        # 创建主窗口小部件并设置为主窗口的中央部件
        main_widget = QWidget()
        self.setCentralWidget(main_widget)

        # 设置主布局为垂直布局
        main_layout = QVBoxLayout(main_widget)

        # 设置主窗口的样式(背景色、按钮样式等)
        main_widget.setStyleSheet("""
            QWidget {
                background-color: #f0f4f8;
            }
            QLabel {
                border: 2px solid #aaa;
                border-radius: 10px;
                background-color: white;
                padding: 5px;
                box-shadow: 0px 4px 6px rgba(0, 0, 0, 0.1);
            }
            QPushButton {
                font-size: 15px;
                padding: 8px 18px;
                min-width: 100px;
            }
        """)

        # 创建顶部布局:包含加载和保存按钮
        top_layout = QHBoxLayout()
        load_btn = QPushButton("📂 加载图片")  # 加载图片按钮
        save_btn = QPushButton("💾 保存图像")  # 保存图像按钮

        # 连接按钮的点击事件
        load_btn.clicked.connect(self.load_image)
        save_btn.clicked.connect(self.save_image)

        # 将按钮添加到顶部布局
        top_layout.addWidget(load_btn)
        top_layout.addWidget(save_btn)
        top_layout.addStretch()  # 添加弹性空间
        main_layout.addLayout(top_layout)

        # 添加水平分割线
        main_layout.addWidget(self._h_line())

        # 创建图像显示区域布局
        img_layout = QHBoxLayout()
        self.original_label = QLabel("原始图像")  # 原始图像标签
        self.processed_label = QLabel("处理后图像")  # 处理后图像标签

        # 设置图像标签的样式
        for label in (self.original_label, self.processed_label):
            label.setFixedSize(400, 400)  # 设置固定大小
            label.setAlignment(Qt.AlignmentFlag.AlignCenter)  # 设置居中对齐
            label.setStyleSheet("border: 1px solid #ddd;")

        # 将图像标签添加到布局
        img_layout.addWidget(self.original_label)
        img_layout.addWidget(self._v_line())  # 添加垂直分割线
        img_layout.addWidget(self.processed_label)
        img_layout.setSpacing(0)  # 设置布局间距为0

        main_layout.addLayout(img_layout)
        main_layout.addWidget(self._h_line())  # 添加水平分割线

        # 创建底部按钮布局(图像处理功能按钮)
        bottom_layout = QHBoxLayout()

        # 按钮配置列表:包含按钮文字和对应的处理模式
        button_config = [
            ("⚫灰度化", "gray"),
            ("🔍去噪", "denoise"),
            ("✨锐化", "sharpen"),
            ("📊直方图", "histogram"),
            ("🌀傅里叶变换", "dft"),
            ("🔷余弦变换", "dct")
        ]

        # 循环创建所有功能按钮
        for text, func in button_config:
            btn = QPushButton(text)  # 创建按钮
            # 使用lambda闭包绑定处理函数,保持func值
            btn.clicked.connect(lambda _, f=func: self.process(f))
            bottom_layout.addWidget(btn)  # 将按钮添加到布局

        bottom_layout.addStretch()  # 添加弹性空间
        main_layout.addLayout(bottom_layout)  # 将底部布局添加到主布局

        # =============== 新增阈值控制界面 =============== #
        # 创建阈值控制布局
        threshold_layout = QHBoxLayout()

        # 阈值控制标签
        threshold_title = QLabel("🗡️ 阈值分割控制:")
        threshold_title.setStyleSheet("font-weight: bold; color: #2c3e50;")

        # 阈值滑动条
        self.threshold_slider = QSlider(Qt.Horizontal)
        self.threshold_slider.setRange(0, 255)          # 设置范围0-255
        self.threshold_slider.setValue(128)             # 初始值
        self.threshold_slider.setTickInterval(10)       # 刻度间隔
        self.threshold_slider.setTickPosition(QSlider.TicksBelow)
        self.threshold_slider.setStyleSheet("""
            QSlider::groove:horizontal {
                height: 8px;
                background: #ecf0f1;
                border-radius: 4px;
            }
            QSlider::handle:horizontal {
                width: 20px;
                margin: -6px 0;
                background: #3498db;
                border-radius: 10px;
            }
        """)

        # 实时值显示标签
        self.threshold_value = QLabel("128")
        self.threshold_value.setStyleSheet("""
            QLabel {
                min-width: 40px;
                color: #e74c3c;
                font-weight: bold;
                border: 1px solid #ddd;
                padding: 2px 5px;
            }
        """)

        # 连接滑动条值改变信号
        self.threshold_slider.valueChanged.connect(self.update_threshold)

        # 将组件添加到布局
        threshold_layout.addWidget(threshold_title)
        threshold_layout.addWidget(self.threshold_slider)
        threshold_layout.addWidget(self.threshold_value)
        main_layout.addLayout(threshold_layout)  # 添加到主布局

    # 辅助方法:创建水平分割线
    def _h_line(self):
        line = QFrame()
        line.setFrameShape(QFrame.Shape.HLine)  # 设置为水平线
        line.setFrameShadow(QFrame.Shadow.Sunken)  # 设置阴影效果
        line.setStyleSheet("color: #ccc;")  # 设置颜色
        return line

    # 辅助方法:创建垂直分割线
    def _v_line(self):
        line = QFrame()
        line.setFrameShape(QFrame.Shape.VLine)  # 设置为垂直线
        line.setFrameShadow(QFrame.Shadow.Sunken)  # 设置阴影效果
        line.setStyleSheet("color: #ccc;")  # 设置颜色
        return line

    def load_image(self):
        """加载图像文件并初始化显示"""
        # 打开文件选择对话框
        file, _ = QFileDialog.getOpenFileName(
            self, "选择图片", "", "图片文件 (*.png *.jpg *.bmp)"
        )
        if file:  # 如果选择了文件
            img = cv2.imread(file)  # 使用OpenCV读取图像
            if img is None:  # 如果读取失败
                QMessageBox.warning(self, "错误", "无法加载图像")
                return

            # 保存原始图像和初始处理图像
            self.image_data['original'] = img
            self.image_data['processed'] = img.copy()

            # 显示原始图像
            self.show_image(img, self.original_label)

    def save_image(self):
        """保存处理后的图像到文件"""
        if 'processed' not in self.image_data or self.image_data['processed'] is None:
            # 如果没有处理后的图像,显示警告
            QMessageBox.warning(self, "提示", "没有可保存的图像")
            return

        # 打开文件保存对话框
        file, _ = QFileDialog.getSaveFileName(
            self, "保存图像", "", "PNG (*.png);;JPG (*.jpg)"
        )
        if file:  # 如果选择了保存路径
            cv2.imwrite(file, self.image_data['processed'])  # 保存图像
            QMessageBox.information(self, "成功", f"图像已保存:{file}")  # 显示成功消息

    def process(self, mode):
        """图像处理主函数,根据模式选择处理算法"""
        if 'original' not in self.image_data or self.image_data['original'] is None:
            # 如果没有加载原始图像,显示警告
            QMessageBox.warning(self, "提示", "请先加载图片")
            return

        img = self.image_data['original'].copy()  # 获取原始图像副本
        result = None  # 存储处理结果

        # 根据选择的模式执行相应的图像处理
        if mode == "gray":  # 灰度化处理
            result = cv2.cvtColor(img, cv2.COLOR_BGR2GRAY)
            result = cv2.cvtColor(result, cv2.COLOR_GRAY2BGR)  # 转回三通道

        elif mode == "denoise":  # 去噪处理
            # 使用非局部均值去噪算法
            result = cv2.fastNlMeansDenoisingColored(
                img, None, 10, 10, 7, 21
            )

        elif mode == "sharpen":  # 锐化处理
            # 定义锐化核
            kernel = np.array([[-1, -1, -1],
                              [-1, 9, -1],
                              [-1, -1, -1]])
            result = cv2.filter2D(img, -1, kernel)  # 应用锐化核

        elif mode == "histogram":  # 灰度直方图
            gray = cv2.cvtColor(img, cv2.COLOR_BGR2GRAY)  # 转为灰度图
            hist = cv2.calcHist([gray], [0], None, [256], [0, 256])  # 计算直方图

            # 创建直方图可视化图像
            hist_img = np.zeros((256, 256), dtype=np.uint8)
            cv2.normalize(hist, hist, 0, 255, cv2.NORM_MINMAX)

            # 绘制直方图
            for i in range(256):
                cv2.line(
                    hist_img, (i, 255), (i, 255 - int(hist[i][0])), 255, 1
                )
            result = cv2.cvtColor(hist_img, cv2.COLOR_GRAY2BGR)

        elif mode == "dft":  # 离散傅里叶变换
            gray = cv2.cvtColor(img, cv2.COLOR_BGR2GRAY)  # 转为灰度图
            dft = cv2.dft(np.float32(gray), flags=cv2.DFT_COMPLEX_OUTPUT)
            dft_shift = np.fft.fftshift(dft)  # 将低频部分移到中心

            # 计算幅度谱并归一化
            magnitude_spectrum = 20 * np.log(
                cv2.magnitude(dft_shift[:,:,0], dft_shift[:,:,1])
            )
            result = cv2.normalize(
                magnitude_spectrum, None, 0, 255, cv2.NORM_MINMAX, dtype=cv2.CV_8U
            )
            result = cv2.cvtColor(result, cv2.COLOR_GRAY2BGR)

        elif mode == "dct":  # 离散余弦变换
            gray = cv2.cvtColor(img, cv2.COLOR_BGR2GRAY)  # 转为灰度图
            gray_float = np.float32(gray)  # 转换为浮点类型
            dct = cv2.dct(gray_float)  # 执行DCT变换

            # 取绝对值并归一化
            result = cv2.normalize(
                np.abs(dct), None, 0, 255, cv2.NORM_MINMAX, dtype=cv2.CV_8U
            )
            result = cv2.cvtColor(result, cv2.COLOR_GRAY2BGR)

        if result is not None:  # 如果处理成功
            self.image_data['processed'] = result  # 保存处理结果
            self.show_image(result, self.processed_label)  # 显示处理后的图像

    def show_image(self, img, label):
        """将OpenCV图像转换为QImage并显示在标签中"""
        # 确保图像是三通道格式
        if len(img.shape) == 2:  # 如果是灰度图
            rgb = cv2.cvtColor(img, cv2.COLOR_GRAY2RGB)
        else:  # 如果是彩色图
            rgb = cv2.cvtColor(img, cv2.COLOR_BGR2RGB)

        # 获取图像尺寸和通道数
        h, w, ch = rgb.shape
        bytes_per_line = ch * w  # 每行的字节数

        # 转换为QImage格式
        q_img = QImage(
            rgb.data, w, h, bytes_per_line, QImage.Format.Format_RGB888
        )

        # 设置标签的图像,保持宽高比
        label.setPixmap(
            QPixmap.fromImage(q_img).scaled(
                350, 350, Qt.AspectRatioMode.KeepAspectRatio
            )
        )

    def update_threshold(self, value):
        """实时更新阈值分割结果"""
        if self.image_data['original'] is None:
            return

        # 更新显示值
        self.threshold_value.setText(str(value))

        # 获取原始图像并转为灰度
        img = self.image_data['original'].copy()
        gray = cv2.cvtColor(img, cv2.COLOR_BGR2GRAY)

        # 应用阈值分割
        _, thresh = cv2.threshold(gray, value, 255, cv2.THRESH_BINARY)

        # 转为三通道用于显示
        thresh_bgr = cv2.cvtColor(thresh, cv2.COLOR_GRAY2BGR)

        # 更新处理结果并显示
        self.image_data['processed'] = thresh_bgr
        self.show_image(thresh_bgr, self.processed_label)

if __name__ == "__main__":
    # 启动应用程序
    app = QApplication(sys.argv)
    window = ImageProcessor()  # 创建主窗口实例
    window.show()  # 显示窗口
    sys.exit(app.exec())  # 运行应用程序事件循环


 1101
1101

 被折叠的 条评论
为什么被折叠?
被折叠的 条评论
为什么被折叠?
 到【灌水乐园】发言


