 随机漫步可视化


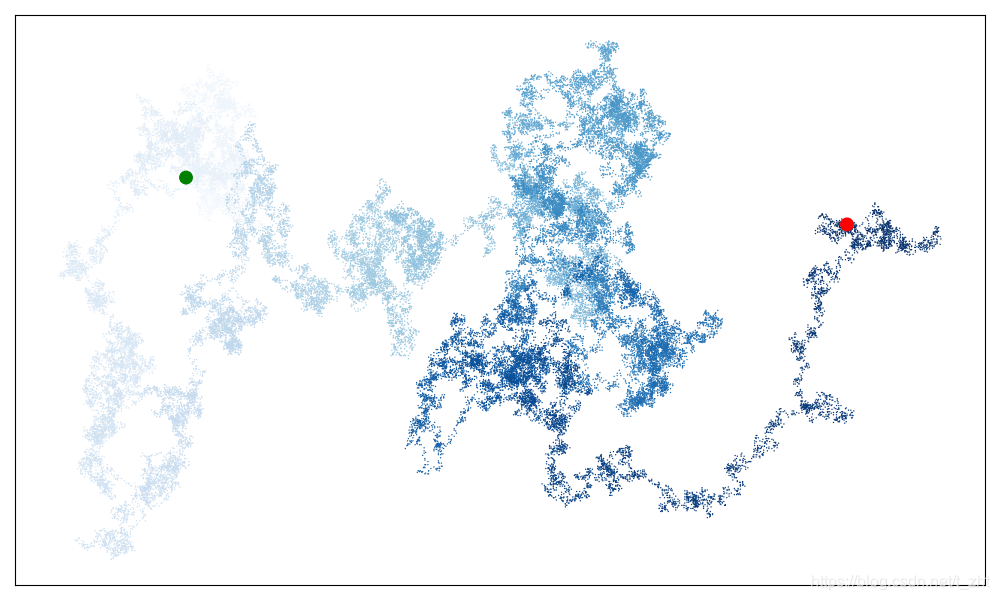
 本文介绍了一个使用Python实现的随机漫步算法,并通过Matplotlib将其可视化。随机漫步是一种数学概念,用于模拟自然界中诸如分子运动等随机过程。文章展示了如何生成大量的随机点,并用不同的颜色表示点的顺序,同时突出了起点和终点的位置。
Scatter() 用来画点 plot()用来画线 plt.savefig() 将图表保存
random_walk.py
from random import choice
class RandomWalk():
    def __init__(self,num_points=5000):
        self.num_points=num_points
        self.x_values=[0]
        self.y_values=[0]

    def fill_walk(self):
        while len(self.x_values)<self.num_points:
            x_direction=choice([1,-1])
            x_distance=choice([0,1,2,3,4])
            x_step=x_direction*x_distance
            y_direction=choice([1,-1])
            y_distance=choice([0,1,2,3,4])
            y_step=y_direction*y_distance

            if x_step==0 and y_step==0:
                continue

            next_x=self.x_values[-1]+x_step
            next_y=self.y_values[-1]+y_step

            self.y_values.append(next_y)
            self.x_values.append(next_x)
rw_visual.py
import matplotlib.pyplot as plt
from random_walk import RandomWalk
while True:
    rw=RandomWalk(50000)
    rw.fill_walk()

    #设置绘图窗口尺寸
    plt.figure(figsize=(10,6))
    point_numbers=list(range(rw.num_points))
    plt.scatter(rw.x_values,rw.y_values,c=point_numbers,cmap=plt.cm.Blues,edgecolors='none',s=1)
    #突出起点和终点
    plt.scatter(0,0,c='green',edgecolors='none',s=100)
    plt.scatter(rw.x_values[-1],rw.y_values[-1],c='red',edgecolors='none',s=100)
    #隐藏坐标轴
    plt.axes().get_xaxis().set_visible(False)
    plt.axes().get_yaxis().set_visible(False)
    plt.show()

    keep_running=input("make another walk?(y/n)")
    if keep_running=='n':
        break


 793
793

 被折叠的 条评论
为什么被折叠?
被折叠的 条评论
为什么被折叠?
 到【灌水乐园】发言


