import numpy as np
import pandas as pd
import matplotlib.pyplot as plt
n = 3
catering_sale =r"C:\Users\18703\Desktop\catering_sale.xls"
data = pd.read_excel(catering_sale, index_col = False)
data_y = data[u'销量']
data_x = data[u'日期']
ymean = np.mean(data_y)
ystd = np.std(data_y)
threshold1 = ymean - n * ystd
threshold2 = ymean + n * ystd
outlier = []
outlier_x = []
for i in range(0, len(data_y)):
if (data_y[i] < threshold1)|(data_y[i] > threshold2):
outlier.append(data_y[i])
outlier_x.append(data_x[i])
else:
continue
print('\n异常数据如下:\n')
print(outlier)
print(outlier_x)

plt.plot(data_x, data_y)
plt.plot(outlier_x, outlier, 'ro')
for j in range(len(outlier)):
plt.annotate(outlier[j], xy=(outlier_x[j], outlier[j]), xytext=(outlier_x[j],outlier[j]))
plt.show()
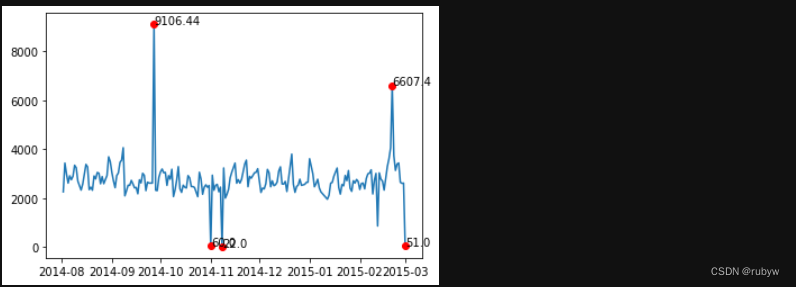


 该代码示例展示了如何基于3倍标准差(3sigma)原则检测数据中的异常值。首先,它读取了一个名为catering_sale.xls的Excel文件,从中提取销量和日期两列。接着,计算销量的平均值和标准差,设定阈值,并找出低于或高于阈值的异常销量数据点,将这些异常值和对应的日期记录下来。最后,用matplotlib可视化正常数据点和异常数据点,并对异常点进行标注。


 206
206

 被折叠的 条评论
为什么被折叠?
被折叠的 条评论
为什么被折叠?
 到【灌水乐园】发言


