


 本文介绍了一种使用Python和JQdata获取股票市场历史数据的方法,通过分析价格的局部极值来判断市场处于牛市还是熊市状态。利用scipy库的argrelextrema函数在指定时间窗口内找到价格的高点和低点,进而划分出牛熊市周期。
利用JQdata获取市场(股票)历史时间段处于牛市状态还是熊市状态
转自 https://www.joinquant.com/post/15536?tag=algorithm
如题,牛市和熊市的交易者心理预期与交易习惯可能是不相同的,为了方便统计不同市场情绪下市场,可以使用历史数据进行简单划分,也可以大致判断目前市场走势处于一个什么状态之中
import numpy as np
import pandas as pd
from scipy.signal import  argrelextrema
from jqdatasdk import *
auth('账号','密码')
data = get_price('000001.XSHG',start_date='2007-01-01',end_date='2018-11-18')
# data.to_csv('000001.csv')
# data = pd.read_csv('000001.csv')  #为防止意外可以先将数据储存下来
def get_bull_or_bear(series,order=100):
    '''获取时间区间所处的牛熊市状态
    传入: series如close, order代表划分前后追朔的数据量,数据量越大,精度越小
    返回: 交易日的牛熊市的分类,series'''

    # 利用scipy在前后order个交易日内寻找极值点
    x=series.values
    high = argrelextrema(x,np.greater,order=order)[0]
    low = argrelextrema(x,np.less,order=order)[0]

    high_s = pd.Series('high',series.iloc[high].index)
    low_s = pd.Series('low',series.iloc[low].index)

    data1 = pd.concat([high_s,low_s]).sort_index()
    other = []
    for i in range(len(data1)-1):               #去除重复值划分
        if data1.iloc[i]==data1.iloc[i+1]:
            other.append(data1.index[i])
    data1.drop(other,inplace=True)

    data1[series.index[-1]] = data1.iloc[-2]     #加上开头与结束的归类
    data1[series.index[0]] = data1.iloc[1]
    data1.sort_index(inplace=True)              # 获得牛熊分界点

    bull_data = pd.Series(False,series.index,name='is_bull')  #获得每一交易日属于牛市期还是熊市期
    if data1[0]=='high': is_bull =False
    else:is_bull=True
    for i in range(len(data1)-1):
        if is_bull:
            bull_data[data1.index[i]:data1.index[i+1]] = True
            is_bull=False
        else:
            is_bull=True
    return bull_data
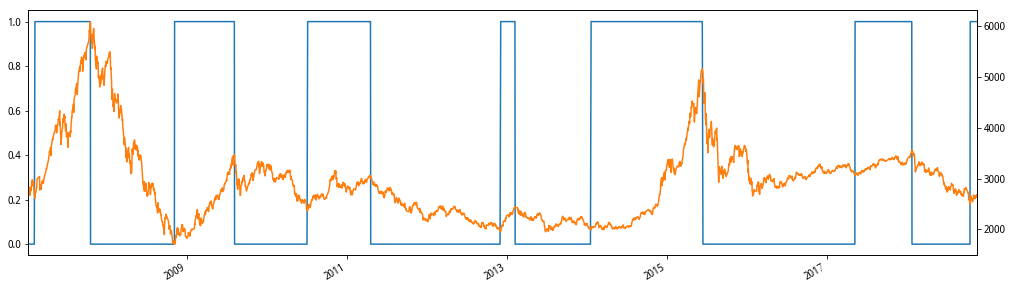
bull_data  = get_bull_or_bear(data.close,100)
bull_data.value_counts()
False    1761
True     1128
Name: is_bull, dtype: int64
ax  = bull_data.plot(style='-',figsize=(17,5))
data.close.plot(secondary_y=True,ax=ax)
<matplotlib.axes._subplots.AxesSubplot at 0x7fe302f34790>
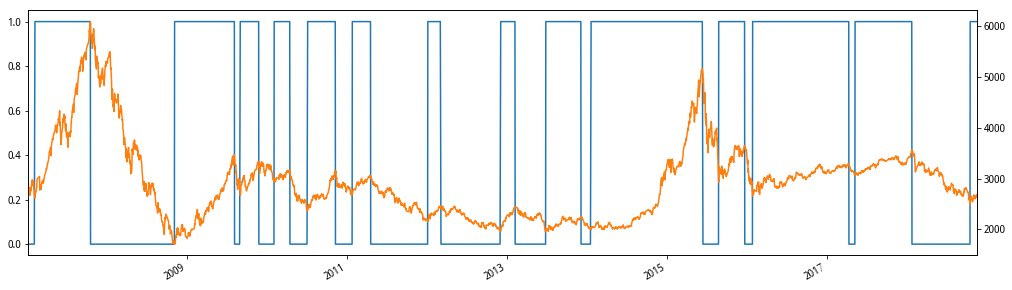
bull_data  = get_bull_or_bear(data.close,50)
ax  = bull_data.plot(style='-',figsize=(17,5))
data.close.plot(secondary_y=True,ax=ax)
<matplotlib.axes._subplots.AxesSubplot at 0x7fe309a63650>
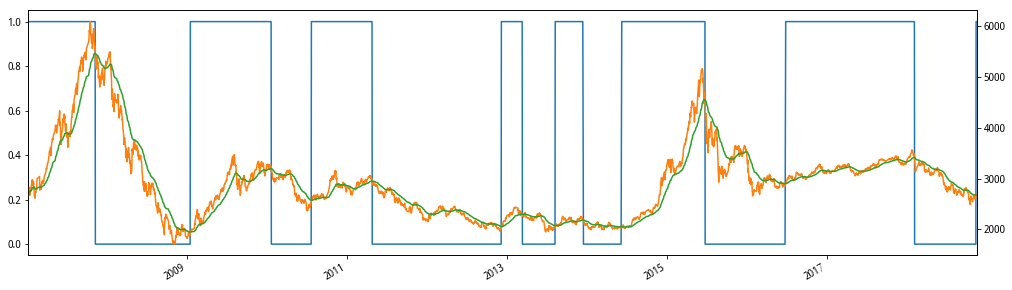
# 很长时间我们可能会沉浸在牛市或者熊市的状态中,实际上早已脱离牛市(熊市),所以使用ema指标简单模拟何时我们发现离开了牛市(熊市)
series = pd.ewma(data.close,span=50)
bull_data  = get_bull_or_bear(series,100)
ax  = bull_data.plot(style='-',figsize=(17,5))
data.close.plot(secondary_y=True,ax=ax)
series.plot(secondary_y=True,ax=ax)
/opt/conda/envs/python2new/lib/python2.7/site-packages/ipykernel_launcher.py:2: FutureWarning: pd.ewm_mean is deprecated for Series and will be removed in a future version, replace with
	Series.ewm(ignore_na=False,span=50,min_periods=0,adjust=True).mean()
<matplotlib.axes._subplots.AxesSubplot at 0x7fe309d16350>


 5745
5745

 被折叠的 条评论
为什么被折叠?
被折叠的 条评论
为什么被折叠?
 到【灌水乐园】发言


