


1.简介
一篇优秀的论文怎么少的了好看的图呢?下面这张图是不是优雅又专业?哈哈哈哈。
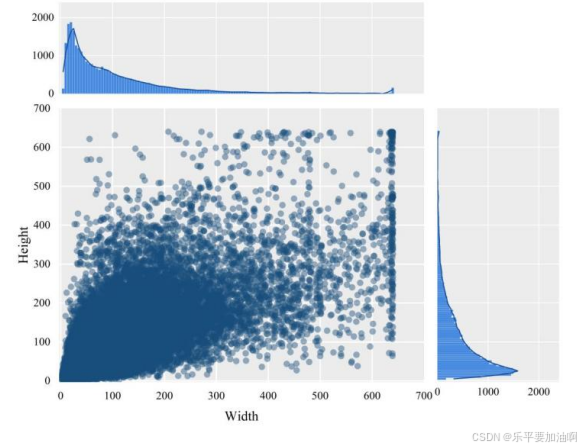
分析一下这张图哈,横坐标为物体的宽(在像素坐标系下的宽度),纵坐标为物体的高(在像素坐标系下的高度)
接下来会提供数据集(yolo)散点图的代码。
2.前期准备
pycharm +yolo格式数据集(包括图片文件夹和TXT文件夹)
3.代码
import os
from PIL import Image
from openpyxl import Workbook

def save_dimensions_to_excel(image_folder, txt_folder, output_file):
    # 创建一个新的工作簿和工作表
    workbook = Workbook()
    sheet = workbook.active

    # 写入表头
    sheet.cell(row=1, column=1, value="实际宽度")
    sheet.cell(row=1, column=2, value="实际高度")

    # 初始化行号
    row_num = 2

    # 遍历txt文件夹中的所有文件
    for txt_file in os.listdir(txt_folder):
        # 检查文件是否以.txt结尾
        if txt_file.endswith(".txt"):
            txt_path = os.path.join(txt_folder, txt_file)
            image_name = txt_file[:-4]  # 去掉.txt后缀

            # 尝试加载不同格式的图像文件
            image_extensions = ['.jpg', '.jpeg', '.png', '.bmp']
            image_path = None
            for ext in image_extensions:
                temp_path = os.path.join(image_folder, image_name + ext)
                if os.path.exists(temp_path):
                    image_path = temp_path
                    break

            # 检查是否找到对应的图像文件
            if image_path:
                # 读取图像的宽度和高度
                with Image.open(image_path) as img:
                    image_width, image_height = img.size

                # 读取txt文件中的所有行
                with open(txt_path, 'r') as file:
                    lines = file.readlines()

                    # 遍历每一行并计算实际宽度和高度
                    for line in lines:
                        values = line.strip().split()
                        width_normalized = float(values[3])
                        height_normalized = float(values[4])

                        # 计算实际宽度和高度
                        actual_width = width_normalized * image_width
                        actual_height = height_normalized * image_height

                        # 打印实际宽度和高度
                        print(f"实际宽度: {actual_width:.2f}, 实际高度: {actual_height:.2f}")

                        # 将实际宽度和高度写入Excel文件
                        sheet.cell(row=row_num, column=1, value=actual_width)
                        sheet.cell(row=row_num, column=2, value=actual_height)

                        row_num += 1

    # 保存Excel文件
    workbook.save(output_file)
    print(f"结果已保存到 {output_file}")


# 指定图像文件夹、txt文件夹和输出Excel文件的路径
# 指定图像文件夹、txt文件夹和输出Excel文件的路径
image_folder = r"E:\BaiduNetdiskDownload\data7\images"
txt_folder = r"E:\BaiduNetdiskDownload\data7\labels"
output_file = "output.xlsx"
# 调用函数将实际宽度和高度保存到Excel文件
save_dimensions_to_excel(image_folder, txt_folder, output_file)
4.结论
这个代码会生成一个excel文件,包含数据集中所有物体在像素坐标系下的宽度和高度。


 被折叠的 条评论
为什么被折叠?
被折叠的 条评论
为什么被折叠?
 到【灌水乐园】发言


