


一.matplotlib还可以绘制条形图、散点图、柱形图、盒图,每种图形都有自己的应用场景
1.折线图通常用来表现数据的变化趋势
2.条形图通常用来对数据进行比较
3.散点图通常用来表现数据的分布等
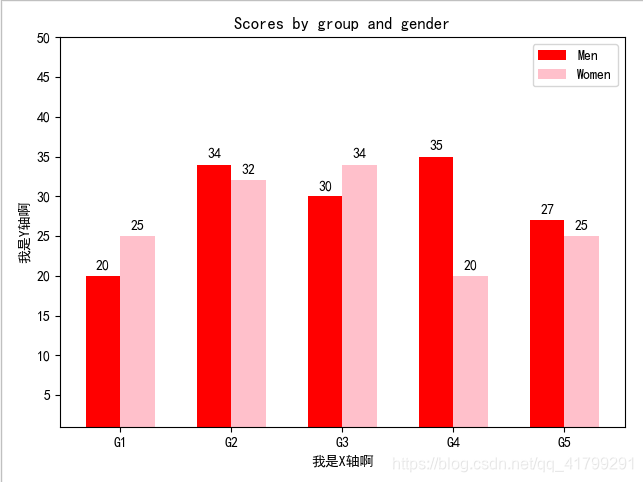
1.直方图:
# -*- coding:utf-8 -*-
import matplotlib
import matplotlib.pyplot as plt
from matplotlib.pyplot import MultipleLocator
import numpy as np


# 展示直方图
def show_histogram(y1,y2):
    # 解决中文乱码问题
    plt.rcParams['font.sans-serif'] = ['Simhei']
    labels = ['G1', 'G2', 'G3', 'G4', 'G5']
    men_means = y1
    women_means = y2

    x = np.arange(len(labels))  # the label locations
    width = 0.31  # the width of the bars 宽度

    fig, ax = plt.subplots()
    # 展示第一根柱状图
    rects1 = ax.bar(x - width / 2, men_means, width, label='Men', color='red')
    # 展示第二根柱状图
    rects2 = ax.bar(x + width / 2, women_means, width, label='Women', color='pink')

    # Add some text for labels, title and custom x-axis tick labels, etc.
    ax.set_ylabel(u'我是Y轴啊')  # y轴标签
    ax.set_xlabel(u'我是X轴啊')  # x轴标签
    ax.set_title('Scores by group and gender')  # title
    ax.set_xticks(x)
    ax.set_xticklabels(labels)
    ax.legend()

    def autolabel(rects):
        """Attach a text label above each bar in *rects*, displaying its height."""
        for rect in rects:
            height = rect.get_height()
            ax.annotate('{}'.format(height),
                        xy=(rect.get_x() + rect.get_width() / 2, height),
                        xytext=(0, 3),  # 3 points vertical offset
                        textcoords="offset points",
                        ha='center', va='bottom')

    # 在bar上面展示bar的数量
    autolabel(rects1)
    autolabel(rects2)

    fig.tight_layout()

    # # 使X轴的标签倾斜
    # plt.xticks(rotation=70)
    # # 使Y轴的标签倾斜
    # plt.yticks(rotation=70)

    # 定义Y轴的间距
    jj = plt.gca()

    # 设置Y轴间距 5的倍数 X轴同理
    y_major_locator = MultipleLocator(5)
    jj.yaxis.set_major_locator(y_major_locator)

    # 定义Y轴的数据范围
    plt.ylim(1, 50)
    # 生成网格
    # plt.grid()
    # 展示
    plt.show()


if __name__ == "__main__":
    men_means = [20, 34, 30, 35, 27]
    women_means = [25, 32, 34, 20, 25]
    show_histogram(men_means, women_means)
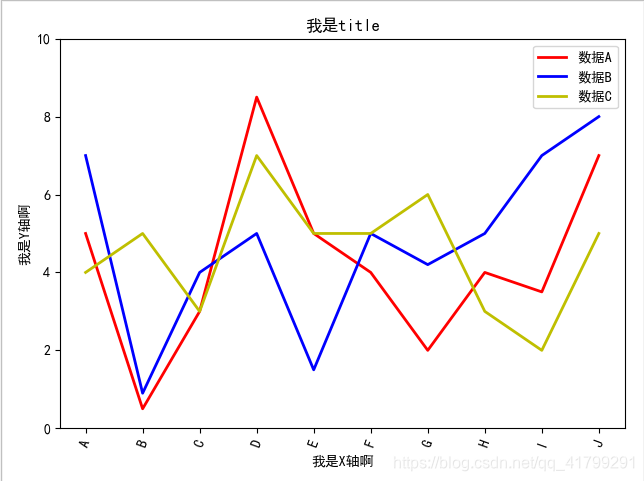
2.折线图:
# -*- coding:utf-8 -*-
import matplotlib
import matplotlib.pyplot as plt
from matplotlib.pyplot import MultipleLocator
import numpy as np

# 展示折线图
def show_polygonal_chart(y1,y2,y3):
    #  解决中文乱码问题
    plt.rcParams['font.sans-serif'] = ['Simhei']

    # 自定义X轴
    data1_x = ['A', 'B', 'C', 'D', 'E', 'F', 'G', 'H', 'I', 'J']
    # 把自定义x轴数据 放入xticks中 ,rotation参数让x轴倾斜
    plt.xticks(range(len(data1_x)), data1_x, rotation=70)

    # Y轴数据
    data1 = y1
    data2 = y2
    data3 = y3
    # 展示一条折线图 颜色 粗细 类型 标签
    plt.plot(data1, color='r', linewidth=2, linestyle='-', label=u'数据A')  # 引用画图库中的pyplot模块
    # 展示二条折线图
    plt.plot(data2, color='b', linewidth=2, linestyle='-', label=u'数据B')  # 引用画图库中的pyplot模块
    # 展示三条折线图
    plt.plot(data3, color='y', linewidth=2, linestyle='-', label=u'数据C')  # 引用画图库中的pyplot模块
    # 标签展示位置,数字代表标签具位置 1,2,3,4 位置从右上角开始
    plt.legend(loc=1)
    plt.title(u"我是title")
    plt.xlabel(u'我是X轴啊')
    plt.ylabel(u'我是Y轴啊')
    # 定义Y轴的间距
    jj = plt.gca()
    # 设置Y轴间距 2的倍数
    y_major_locator = MultipleLocator(2)
    jj.yaxis.set_major_locator(y_major_locator)

    # 定义Y轴的数据范围 不写会根据具体的数据生成一个范围
    plt.ylim(0, 10)
    # 展示图
    plt.show()


if __name__ == "__main__":
    # Y轴数据
    data1 = [5, 0.5, 3, 8.5, 5, 4, 2, 4, 3.5, 7]
    data2 = [7, 0.9, 4, 5, 1.5, 5, 4.2, 5, 7, 8]
    data3 = [4, 5, 3, 7, 5, 5, 6, 3, 2, 5]
    show_polygonal_chart(data1, data2, data3)
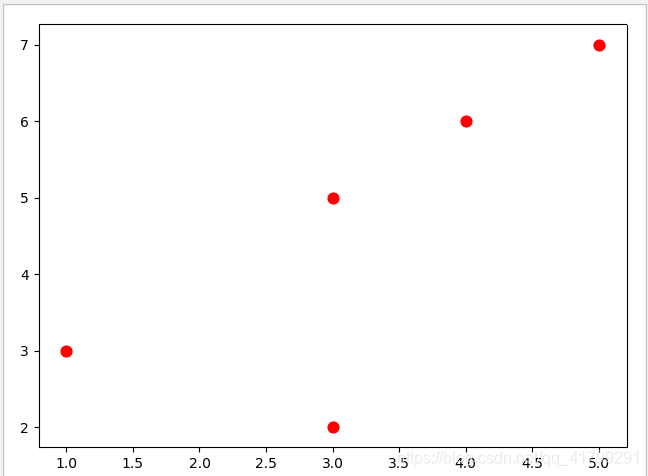
3.散点图:
# -*- coding:utf-8 -*-
import numpy as np
import matplotlib.pyplot as plt

# 绘制散点图
x = [1,3,4,5,3]
y = [3,5,6,7,2]
# 设置点的大小 颜色
plt.scatter(x, y,c='r',s=60)
plt.show()


 934
934

 被折叠的 条评论
为什么被折叠?
被折叠的 条评论
为什么被折叠?
 到【灌水乐园】发言


