


目录
Wavefront occupancy customization
Wavefront occupancy and event timing window synchronization
The anatomy of an event 事件的组成结构解析
Events Windows
This section of RGP is where users will perform most analysis at the event level. An RGP event is simply an API call within a command buffer that was issued by either the application or the driver.
The event windows allow filtering of the event string. The event string consists of the event index, the API call and parameters. Only events containing the filter string will be displayed. This works for the whole event string, not just the event index. For example, if the filter string is ‘8’, event 31 may be displayed if any of its parameters contain ‘8’.
这部分RGP基本是基于事件级别上的分析。一个RGP事件简单来讲就是发生在command buffer 内的一次API调用,可以是应用程序发出的也可以是driver发出的。
事件窗口允许对事件字符串进行筛选。事件字符串由事件索引、API调用和参数组成。只有包含筛选字符串的事件才会显示出来。这适用于整个事件字符串,而不仅仅是事件索引。例如,如果筛选字符串是'8',则如果事件31的任何参数包含'8',它也可能会被显示出来。
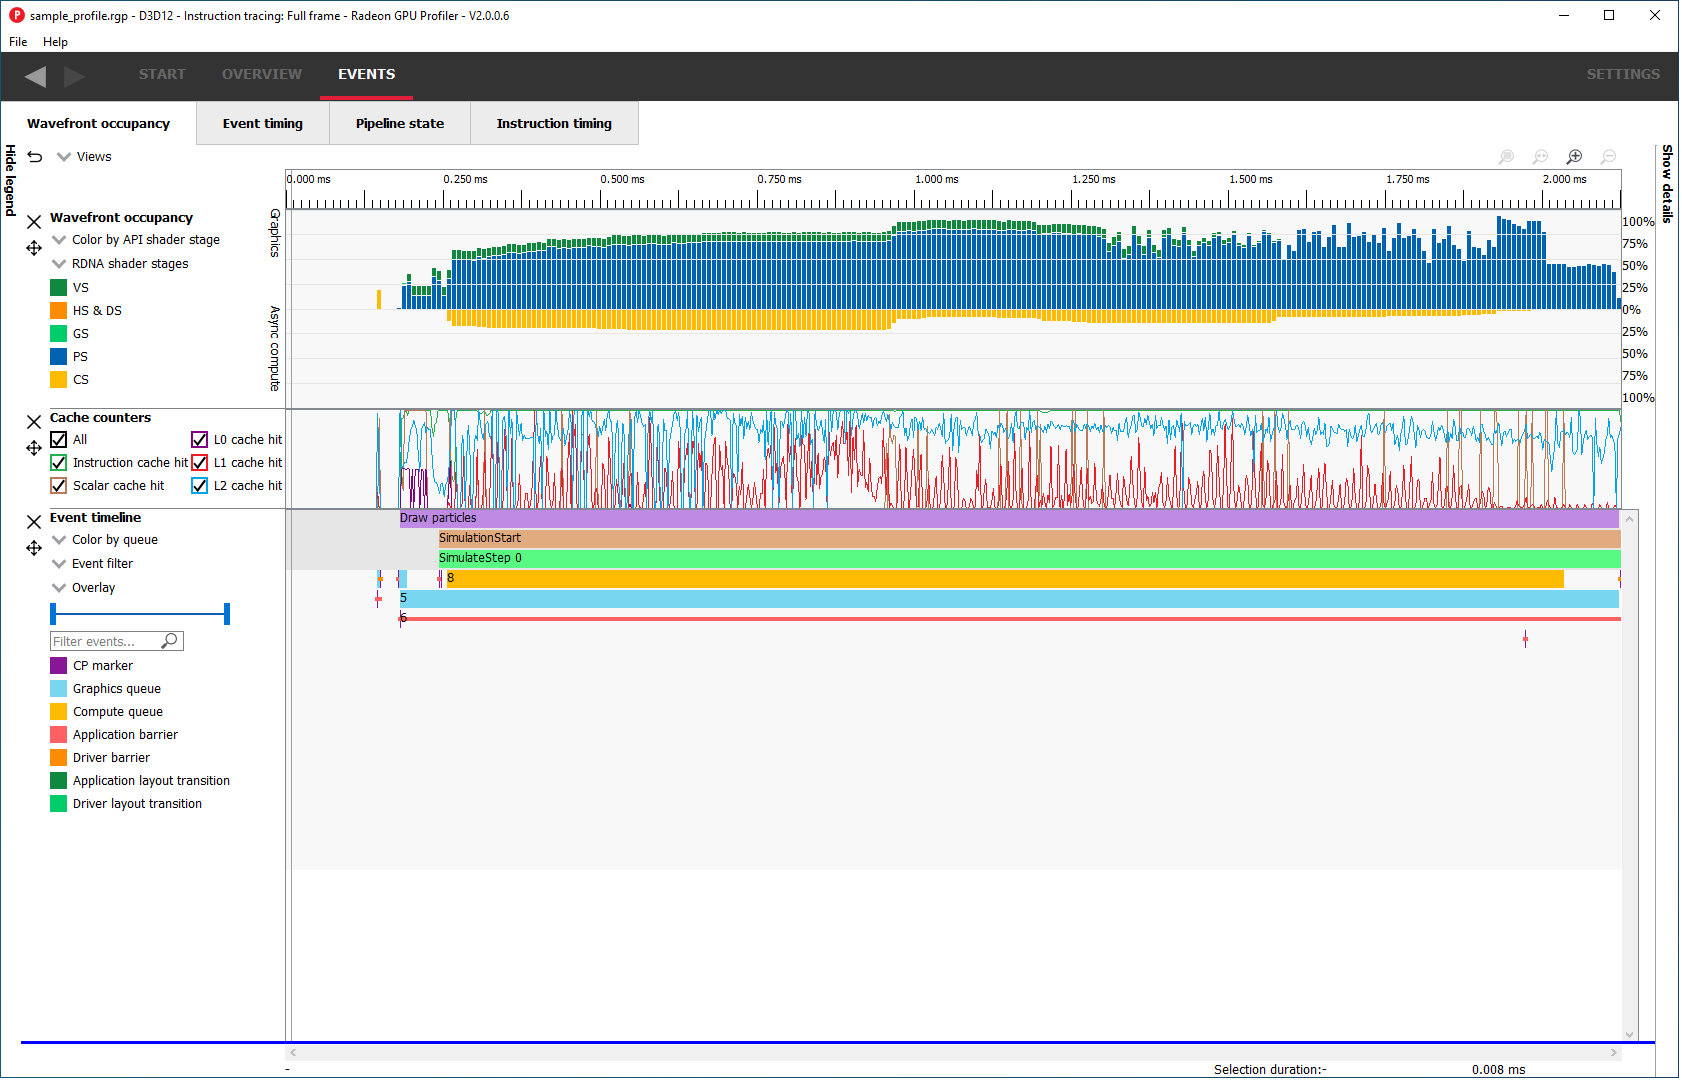
Wavefront occupancy
This section presents users with an interactive timeline that shows GPU utilization, GPU counter data, and all events in the profile.
There are five components, the Legend side panel, the Wavefront timeline view, one or more Counter views, the Events timeline view, and the Details side panel.
Note that the counter views are only available if the “Collect counters” checkbox is enabled in RDP.
这个部分是用时间轴的形式提供了可以交互的数据,显示了GPU utilization(GPU利用率)、GPU counter data(GPU计数器数据)和profile 过程中的所有事件。
该部分由五个组件组成,包括图例侧面板(Legend side panel)、Wavefront 时间轴视图、一个或多个计数器视图、事件时间轴视图和详细信息侧面板。
请注意,只有在RDP中启用了“Collect counters”复选框时,计数器视图才可用。
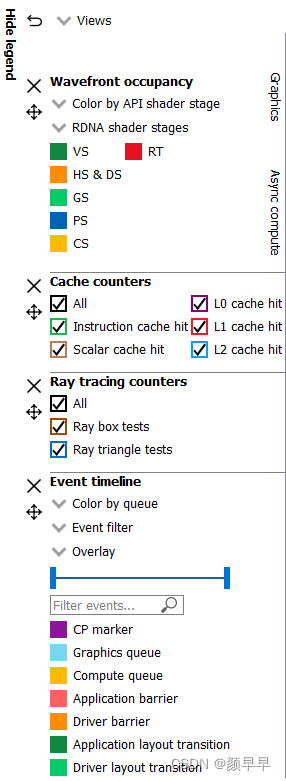
Legend side panel(图例侧面板)
Pressing Hide Legend on the top left will hide the side panel with visualization controls and a color coded legend for each view. The contents of each individual legend depends on its view.
点击左上角的“Hide Legend(隐藏图例)”按钮将隐藏包含可视化控件和每个视图的颜色编码图例的侧面板。每个单独图例的内容取决于其所在的视图。
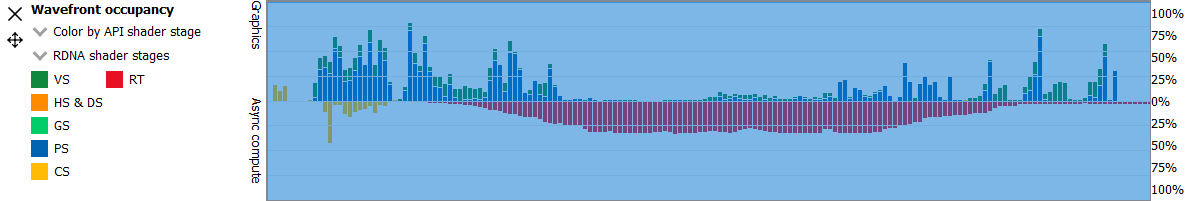
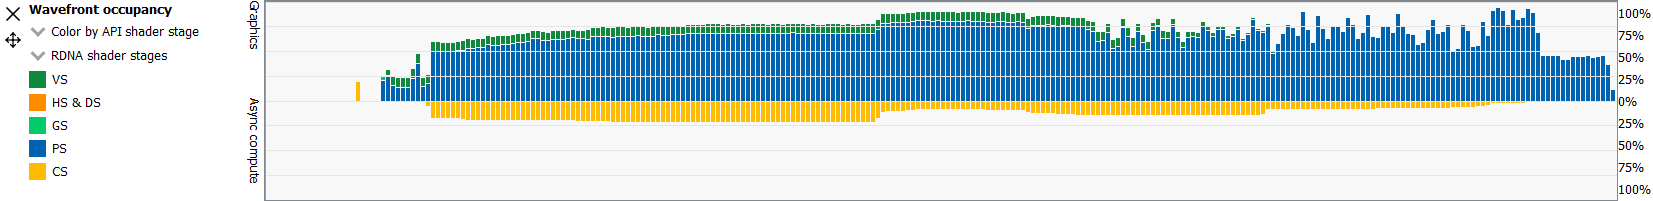
Wavefront timeline
This section shows how many wavefronts were in flight. All wavefronts are grouped into buckets which are represented by vertical bars. The top half shows wavefronts on the graphics queue, and the bottom half shows wavefronts on the async compute queue.
这部分展示了当前正在执行的 wavefront 数量。所有 wavefront 被分组到不同的bucket中,每个bucket用一个柱子表示。上半部分显示图形队列中的 wavefront,下半部分显示异步计算队列中的 wavefront。
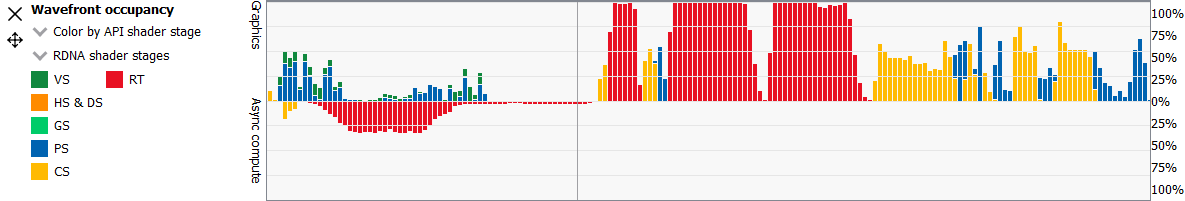
Users may examine regions by selecting ranges within the graph and using the zoom buttons on the top right of the tab. Users may also hover over this view and use mouse wheel to zoom and center in on a particular spot. A region of wavefronts can be selected by using the mouse button to drag over the desired region as shown below.
如果想要查看一个范围内的数据,可以通过在图表中点击选择一个范围,也可以用选项卡右上角的缩放按钮,或者把鼠标悬停在这个视图上并且用鼠标滚轮进行缩放。可以通过使用鼠标按钮拖动所需区域来选择 wavefront 区域,如下所示。
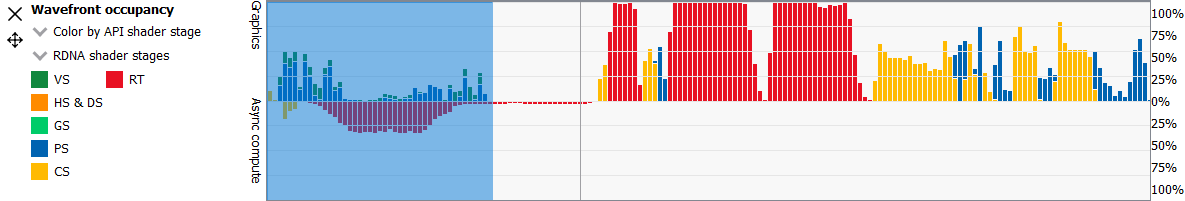
You can zoom into the region by selecting Ctrl + Z, or by clicking on “Zoom to selection” (result shown below).
您可以通过选择 Ctrl + Z 或点击“缩放到选择”来放大该区域(结果如下)。
如果已经放大,可以按住空格键,用鼠标拖动图表实现移动。
You can also drag the graph if you are zoomed in. Hold down the space bar first, then hold the mouse button down. The graph will now move with the mouse.
Users may use the Color by combo-box on the top of the Wavefront occupancy legend to visualize wavefronts in different ways:
Color by API stage. Default. Shows which wavefronts correspond to which Vulkan/DX12 pipeline stage.
Color by RDNA (or GCN) shader stage. Shows which wavefronts correspond to which RDNA/GCN pipeline stage.
Color by hardware context. Shows which hardware context (0-7) the wavefronts ran on. This can be useful to visualize the amount of context rolls that occurred.
Color by limiting factor. Shows the limiting factor for the occupancy of that shader.
Color by shader engine. Shows which shader engine the wavefronts ran on.
Color by event. Shows which wavefronts correspond to which event of the profile. Each event is assigned a unique color.
Color by pass. Groups wavefronts into different passes depending on which render target or attachment type (color, depth-only, compute, raytrace). These four types are assigned a base color, and each pass within each type is assigned a different shade of the base color. This can be useful to visualize when the application attempted to render different portions of a scene.
Color by API PSO Shows which wavefronts correspond to which shader, based on the shader’s API PSO hash value.
Color by ray tracing Shows which wavefronts correspond to shaders which perform ray tracing. Wavefronts from traditional ray tracing events as well as wavefronts from shaders with inlined ray tracing will be shown using the specified ray tracing color. All other waves will be shown as grey.
Color by indirect command Shows which wavefronts correspond to which indirect commands of the profile. Each indirect command is assigned a unique color. All other waves will be shown as grey.
用户可以使用Wavefront occupancy legend 上面的“Color by ……”下拉框选择用什么方式可视化 wavefront:
- 按 API 阶段着色:默认设置。显示哪些 wavefront 对应于哪个 Vulkan/DX12 管线阶段。
- 按 RDNA(或 GCN)着色器阶段着色:显示哪些 wavefront 对应于哪个 RDNA/GCN 管线阶段。(RDNA/GCN是AMD GPU 的架构,代表了硬件层面的不同阶段。)
- 按硬件context着色:显示 wavefront 运行的硬件context(0-7)。这对于可视化发生的context rolls数量非常有用。
- 按限制因素着色:显示该着色器的占用限制因素。
- 按着色器引擎着色:显示 wavefront 运行的着色器引擎。
- 按事件着色:显示哪些 wavefront 对应于性能分析的哪些事件。每个事件单独一个颜色。
- 按pass着色:首先是根据render target 或附件类型(颜色、深度、计算、光线追踪),将 wavefront 分成四类:颜色、深度、计算、光追,每个类型会有一个基础颜色(比如红黄绿蓝)。接着,每种类型内部又根据所处pass的不同,颜色略有不同,比如红色分为了深红浅红)。这样一来,可以直观地区分出wavefront都在渲染什么。
- 按 API PSO 着色:显示哪些 wavefront 对应于哪个着色器,基于着色器的 API PSO 哈希值。(每个 PSO(Pipeline State Object) 定义了一个特定的图形或计算管线的状态,包括所有必要的配置,如着色器、渲染目标、混合状态等,PSO和pipeline之间是基本上一一对应的关系。)
- 按光线追踪着色:哪些 wavefront 对应于执行光线追踪的着色器。传统光线追踪事件的 wavefront 以及带内联光线追踪的着色器的 wavefront 将使用指定的光线追踪颜色显示。所有其他 wavefront 将显示为灰色。
- 按间接命令着色:显示哪些 wavefront 对应于性能分析的哪些间接命令。每个间接命令被分配一个独特的颜色。所有其他 wavefront 将显示为灰色。
Color modes can be synchronized across the Wavefront occupancy and Event timing panes. To do this, simply hold down the Ctrl key when selecting a mode from any Color by combo box. The selected color mode will be used for the Wavefront timeline and the Event timeline in the Wavefront occupancy pane as well as for the Event timing pane.
Beneath the Color by combo-box there is another combo-box to help visualize the occupancy of certain RDNA or GCN pipeline stages. Beneath the pipeline stage combo-box is a color coded legend which serve as color reminders. Note these colors can be customized within Settings.
The RGP wavefront occupancy for OpenCL or HIP has only compute in the wavefront occupancy. This is because compute APIs such as OpenCL or HIP only dispatch compute shader waves. For this same reason, a number of the coloring options such as hardware context and RDNA/GCN stages are not applicable for OpenCL or HIP.
颜色模式可以在Wavefront occupancy和事件时间窗格之间同步。在选择“Color by ……”的同时按住 Ctrl 键,被选中的颜色模式就会同时 Wavefront 时间线和 Wavefront occupancy 窗格中的Event时间线,以及 Event timing 窗格。
在“Color by ……”下拉框下方,还有另一个下拉框,用于帮助可视化特定 RDNA 或 GCN 管线阶段的占用。在管线阶段下拉框下方有一个颜色编码的图例,作为颜色提醒。请注意,这些颜色可以在设置中自定义。
对于 OpenCL 或 HIP,RGP 的 wavefront 占用仅包含计算部分。这是因为计算 API(如 OpenCL 或 HIP)仅调度计算着色器的 wave。出于同样的原因,一些着色选项(如硬件上下文和 RDNA/GCN 阶段)不适用于 OpenCL 或 HIP。

Cache counters
This section visualizes the cache counter data collected while profiling. Cache counter data is only available on Radeon RX 5000 series and newer GPUs. While profiling, counter data is sampled at a fixed rate, roughly one sample every 4096 clock cycles.
这部分是用来可视化分析过程中收集的Cache counter(缓存计数器数据)的。Cache counter 数据仅在 Radeon RX 5000 系列及更新的 GPU 上可用。在分析时,计数器数据以固定速率进行采样,大约每 4096 个时钟周期采样一次。

Each counter is presented as a line graph that shows how the value of that particular counter varies through the frame. By correlating the counter data with both wavefront occupancy and the events in the frame, you can get a better understanding of how well different parts of the frame utilize the various GPU caches.
每个计数器以折线图的形式呈现,显示这个计数器的值这一帧中的变化。通过将计数器数据与 wavefront occupancy 和帧中的event关联,可以更好地理解帧的不同部分都是怎么利用各种 GPU 缓存的。
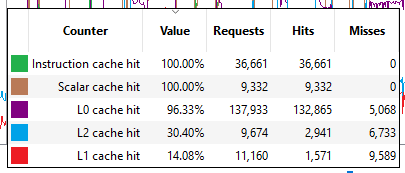
There are currently five cache counters collected while profiling. Each cache counter reports a hit percentage, which is the percentage of requests that hit data already in the cache.
Instruction cache hit The percentage of read requests made that hit the data in the Instruction cache. The Instruction cache supplies shader code to an executing shader. Each request is 64 bytes in size.
Scalar cache hit The percentage of read requests made from executing shader code that hit the data in the Scalar cache. The Scalar cache contains data that does not vary in each thread across the wavefront. Each request is 64 bytes in size.
L0 cache hit The percentage of read requests that hit the data in the L0 cache. The L0 cache contains vector data, which is data that may vary in each thread across the wavefront. Each request is 128 bytes in size.
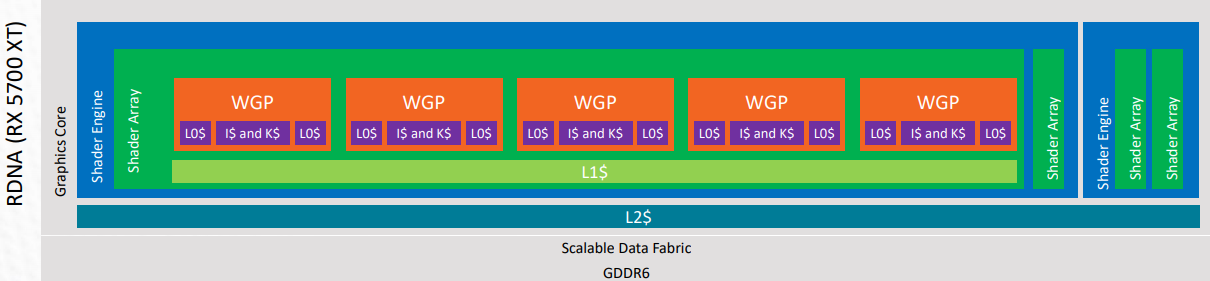
L1 cache hit The percentage of read or write requests that hit the data in the L1 cache. The L1 cache is shared across all WGPs in a single shader engine. Each request is 128 bytes in size.
L2 cache hit The percentage of read or write requests that hit the data in the L2 cache. The L2 cache is shared by many blocks across the GPU, including the Command Processor, Geometry Engine, all WGPs, all Render Backends, and others. Each request is 128 bytes in size.
目前在分析过程中会收集了五个Cache counter。每个Cache counter 都会统计命中百分比,即所有请求中命中缓存中已有数据的请求的百分比。
- 指令缓存命中率:着色器代码读取请求在指令缓存中的命中百分比。指令缓存为执行中的着色器提供代码支持,每次请求数据大小为64字节。
- 标量缓存命中率:执行着色器代码时,标量缓存读取请求的命中百分比。标量缓存存储wavefront中所有线程共享的固定数据,每次请求数据大小为64字节。
- L0缓存命中率:向量数据读取请求在L0缓存中的命中百分比。L0缓存存储可能随线程变化的向量数据,每次请求数据大小为128字节。
- L1缓存命中率:读写请求在L1缓存中的命中百分比。L1缓存在单个着色引擎(shader engine)内的所有WGP(工作组处理器)间共享,每次请求数据大小为128字节。
- L2缓存命中率:读写请求在L2缓存中的命中百分比。L2缓存在GPU多个模块间共享,包括命令处理器、几何引擎、所有WGP、所有渲染后端等,每次请求数据大小为128字节。
The description of each counter can be viewed by hovering the mouse over the counter name in the legend left of the counter graph.
The sizes of the L0, L1 and L2 caches, which may vary depending on the GPU, are reported in the System information pane in the Overview tab.
Users may use the legend on the left to choose which counters to include in the graph.
可以通过将鼠标悬停在计数器图表左侧的计数器名称上查看每个计数器的描述。L0、L1 和 L2 缓存的大小(可能因 GPU 而异)在概述选项卡的系统信息窗格中报告。
用户可以使用左侧的图例选择要包含在图表中的计数器。
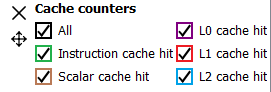
Each counter key in the legend is a tri-state button. Pressing the button cycles through 3 states: visible, visible and selected, and not visible.
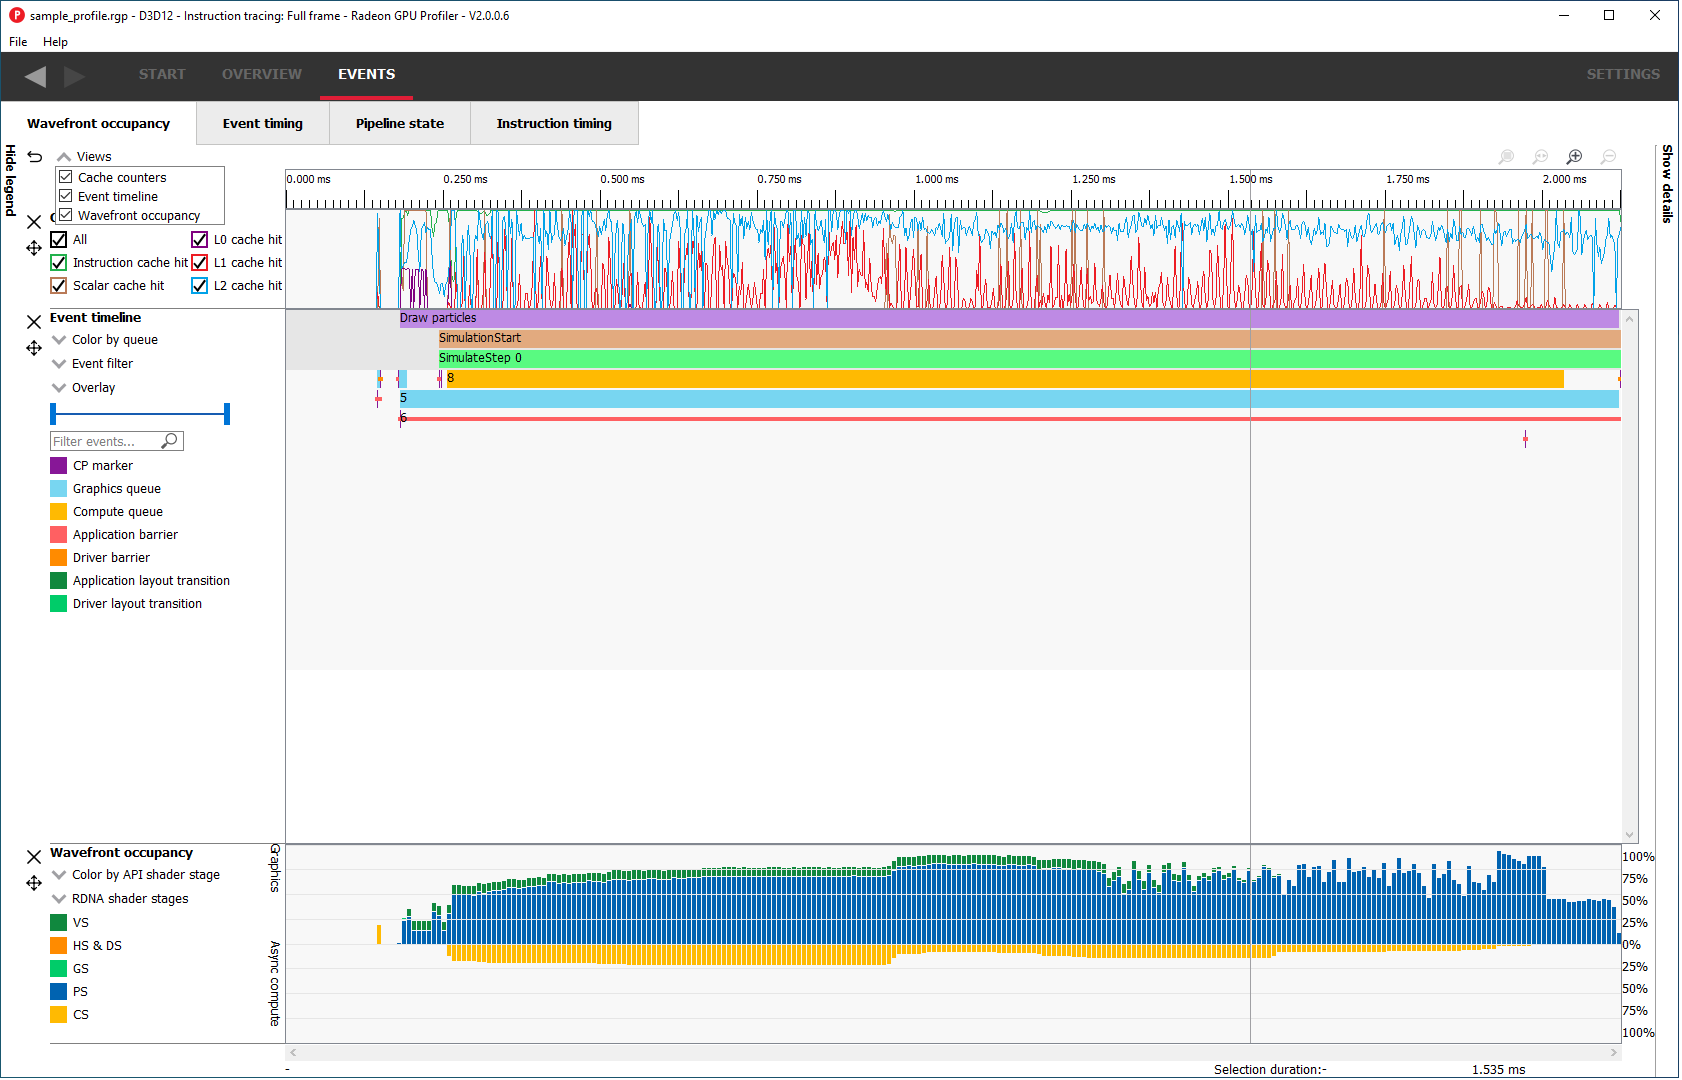
Selecting a counter will cause the area under the line for the selected counter to be filled in. This can be done for one or more counters simultaneously. In this image, the user has clicked the color boxes for both the L1 and L2 cache hit counters.
例中的每个计数器键均为三态按钮,点击可在三种状态间切换:可见、可见且选中、不可见。
选中计数器时,其折线下方区域将被填充色覆盖,支持同时选择多个计数器(如图中用户同时选中L1和L2缓存命中率的情况)。

A tooltip will be shown when the mouse hovers over the counter graphs. This tooltip shows the counter value of the closest point to the cursor, as well as the number of Requests, Hits, and Misses associated with that point. When a region is selected in the wavefront occupancy view, the tooltip will show aggregated data representing the selected region. Pressing the Ctrl key on the keyboard will temporarily hide the tooltip.
鼠标悬停在计数器图表上会显示工具提示,提示包含光标位置最近采样点的计数器数值,以及对应的请求数、命中数和未命中数。若在wavefront Occupancy图中选择特定区域,工具提示将显示该区域内的聚合数据。按下Ctrl键可临时隐藏工具提示。
Collection of cache counters can be disabled when capturing a profile in the Radeon Developer Panel. In this case, the cache counter graphs will not be visible.
For a better understanding of the cache memory hierarchy for RDNA hardware, please refer to the following visual representation. This is taken from the RDNA architecture presentation found on gpuopen.com.
在Radeon开发者面板中采集性能数据时,可禁用缓存计数器收集功能,此时缓存计数器图表将不可见。如需深入了解RDNA硬件的缓存层次结构,请参考以下示意图(源自gpuopen.com网站发布的RDNA架构技术文档)。
Ray tracing counters
When profiling a game that uses ray tracing, a second row of counter data will show ray tracing counter values. These counters are only available on Radeon RX 6000 series and newer GPUs.

There are currently two ray tracing counters collected while profiling. These counters provide information on the number of ray tests performed by the frame.
-
Ray box tests The number of ray box intersection tests.
-
Ray triangle tests The number of ray triangle intersection tests.
The user interaction for the ray tracing counters is identical to the user interaction for the cache counters.
Events timeline
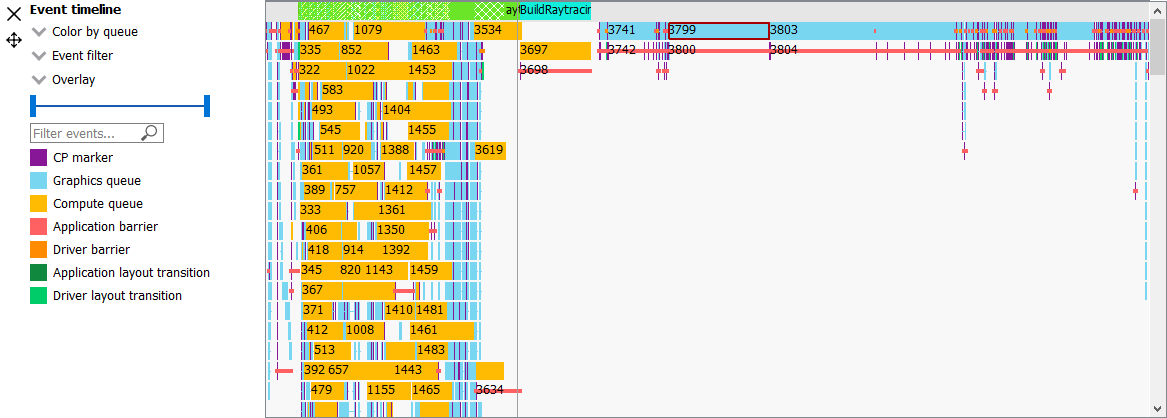
This section shows all events in your profile. This includes both application-issued and driver-issued submissions. Each event can consist of one or more active shader stages and these are shown with rectangular blocks. The longer the block, the longer the shader took to execute. If there is more than 1 shader active, then each shader stage is connected with a thin line to indicate they belong to the same event. This view just shows actual shader work; it doesn’t show when the event was submitted.
这一部分会显示profile中的所有事件,包含应用程序提交和驱动程序提交的操作。每个事件可能包含一个或多个活跃着色器阶段,这些阶段以矩形块形式呈现。矩形块越长,表示该着色器执行耗时越久。若一个事件包含多个活跃着色器,各阶段间将以细线连接,表明它们属于同一事件。另外,这个视图仅显示着色器实际工作时长,不反映事件提交的时间点。
Users may single-click on individual events to see detailed information on the details side panel described below. Zooming into this graph is done by selecting the desired region in the wavefront graph above. Additionally, zooming in on a single event can be done by selecting the event and clicking on ‘Zoom to selection’. More information can be found under the Zoom Controls section.
选中单个事件后,可在右侧详细信息面板查看其具体数据。如果想要放大这个图的某一部分,可以在图上框选一个区域。而且如果想要放大查看一个具体事件,可以选中事件后点击 “Zoom to selection”。 更多缩放操作详见 Zoom Controls 章节。
Users may use the Color by combo-box on the left to visualize events in different ways:
Color by queue. Default. Shows which events were submitted to graphics or async compute queues. In addition, the CP marker is shown in a unique color, as well as the barriers and layout transitions so they can be easily distinguished. Note that barrier and layout transitions originating from the driver are colored differently to those from the application, and this is shown in the legend below the timeline view.
Color by hardware context. Shows which events ran on which context. This can be useful to visualize the amount of context rolls that occurred.
Color by context rolls. Shows which events had their context rolled since the previous event.
Color by limiting factor. Shows the largest limiting factor for the occupancy for any shader in that event.
Color by event. Will show each event in a unique color.
Color by pass. Groups events into different passes depending on which render target or attachment type (color, depth-only, compute). These three types are assigned a base color, and each pass within each type is assigned a different shade of the base color. This can be useful to visualize when the application attempted to render different portions of a scene.
Color by command buffer. Shows each event in a color associated with its command buffer, so making it easy to see events are in the same command buffer.
Color by user events. Will colorize each event depending on which user event it is surrounded by.
Color by API PSO will color events by their API PSO hash values.
Color by instruction timing will only colorize events which contain detailed instruction timing information. All other events will be greyed out.
Color by ray tracing will only colorize raytracing events. All other events will be greyed out.
Color by indirect command Will colorize each event based on which indirect command the event came from. Events launched from the same indirect command get the same unique color. All other events will be greyed out.
通过左侧“Color by” 下拉框可选择模式来查看事件:
- Color by queue(按队列)(默认选项): 区分图形队列与异步计算队列提交的事件。CP标记、屏障(Barrier)和布局转换(Layout Transition)会以独特颜色显示。另外驱动程序生成的Barrier/Layout Transition与应用生成的,会用不同颜色标记,颜色图例显示在时间线下方。
- Color by hardware context(按硬件上下文):显示事件运行在硬件的哪个Context,用于观察Context Roll频率。
- Color by context rolls(按上下文切换):标记由于前一个事件导致了context roll的事件。
- Color by limiting factor(按限制因子):显示事件中限制着色器占用率(Occupancy)的最大因素(如寄存器压力、内存带宽)。
- Color by event(按事件):为每个事件分配唯一颜色。
- Color by pass(按pass):根据渲染目标或附件类型(颜色、仅深度、计算)将事件分组,每个分组有一个基础颜色(比如红黄绿蓝)。接着,每种类型内部又根据所处pass的不同,颜色略有不同,比如红色分为了深红浅红)。此模式可直观显示场景不同部分的渲染时机。
- Color by command buffer(按命令缓冲区):用与命令缓冲区关联的颜色标记事件,便于识别同一命令缓冲区内的事件。
- Color by user events(按用户事件):根据事件所处的用户事件范围着色。
- Color by API PSO(按API管线状态对象):根据API管线状态对象(PSO)哈希值着色事件。
- Color by instruction timing (按指令耗时):只给含有详细指令计时信息的事件着色,其他事件显示为灰色。
- 按光线追踪:仅着色光线追踪相关事件,其他事件显示为灰色。
- Color by indirect command (按间接命令):根据事件来源的间接命令着色,同一间接命令触发的事件颜色相同,其他事件显示为灰色。 |
Beneath the Color by combo-box is the Event filter combo-box. This allows the user to visualize only certain types of events on the timeline. For example, the user can select to see draws, dispatches, clears, barriers, layout transitions, copies, resolves, events containing instruction trace data, and raytracing events. There is also an option to switch the CP marker on or off. Switching the CP marker off will just show the active shader blocks.
在Color by下拉框下方,还可以筛选时间线上显示的事件类型,可选类型包括:绘制(Draw) 、分发(Dispatch)、清屏(Clear)、屏障(Barrier)、布局转换(Layout Transition) 、拷贝(Copy)、解析(Resolve)、含指令追踪数据的事件 、光线追踪事件。还有CP标记开关,关闭后就只会显示活跃着色器块。
Beneath the Event filter combo-box is the Overlay combo-box. This allows the user to select which fixed “Overlays” to show in the timeline. Overlays are shown in one or more rows at the top of the timeline. They are useful to visualize the various states for each event. More than one Overlay can be enabled. The following Overlays are supported:
All. All available overlays will be shown
User events. Default. Displays all user events, if the captured frame contains any such events. The user events are stacked according to the nesting level, and a cross pattern indicates multiple overlapping user event regions. Moving the mouse cursor over one of the user events will show a tool-tip listing all user events under the cursor including timing information for each user event interval.
Hardware context. Displays all hardware contexts. Each hardware context has its own row. This allows the user to visualize the lifetime of each context.
Command buffer. Displays all command buffers. The command buffers are stacked according to the time of submission, so that if one command buffer is submitted before a previous command buffer has completed, the new command buffer will be stacked below the previous command buffer.
Render target. Displays all render targets. If more than one render target is active for a given time period, then the active render targets will be stacked. This allows the user to visualize the usage of render targets over the duration of the frame.
位于Event filter下拉框下方,是 Overlay选择框,支持在时间线顶部叠加显示一些信息,可选模式包括:
- 全部:显示所有可用信息。
- 用户事件(默认):显示这一个capture中包含的所有用户事件。事件按嵌套层级堆叠,交叉图案表示这部分的用户事件是重叠的。悬停鼠标可显示工具提示,列出光标下所有用户事件及其时间区间(鼠标悬停这个功能好像没出现)。
- 硬件上context:显示所有硬件context,每个context独占一行,便于观察其生命周期(一共有8个context,编号从0到7)。
- 命令缓冲区:按提交时间堆叠显示命令缓冲区。若新缓冲区在旧缓冲区未完成时提交,新缓冲区将堆叠在下方。
- Render target:显示所有活跃渲染目标。同一时间段内多个Render target在活动,则这些Render target会堆叠显示,便于观察帧周期内Render target的使用情况。 |
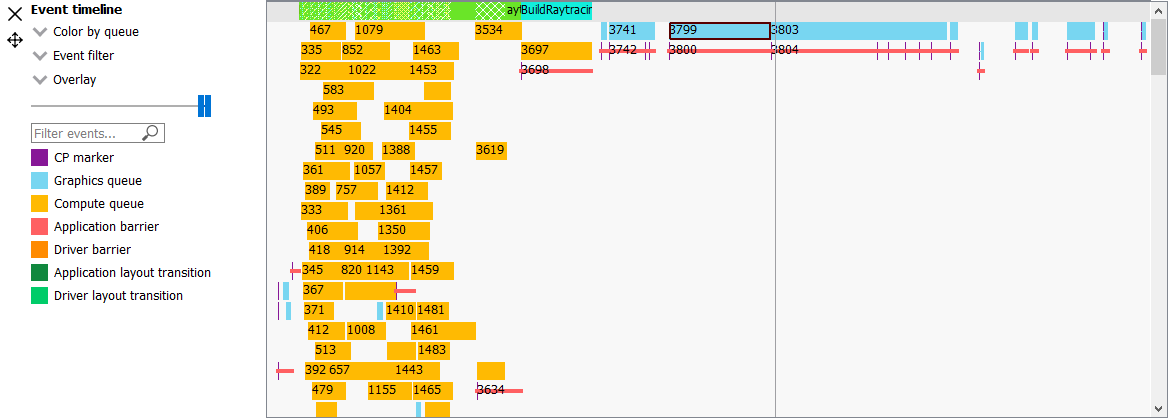
The event duration percentile filter allows users to only see events whose durations fall within a certain percentile. For example, selecting the rightmost-region of the slider will highlight the most expensive events. When using the slider buttons on the duration percentile filter, a tooltip will display the time duration range that corresponds to the selected percentiles. One will also find a textbox to filter the timeline by event name.
The same zooming and dragging that is available on the wavefront timeline view is also available here.
事件耗时百分位过滤器:仅显示耗时处于特定百分位区间的事件(如滑动条最右侧高亮最耗资源事件)。操作滑动条时,工具提示将显示所选百分位对应的时间范围。
事件名称过滤文本框:通过名称关键字筛选时间线事件。
Lastly, there are colored legends on the bottom which serve as color reminders. Note these colors can be customized within Settings.
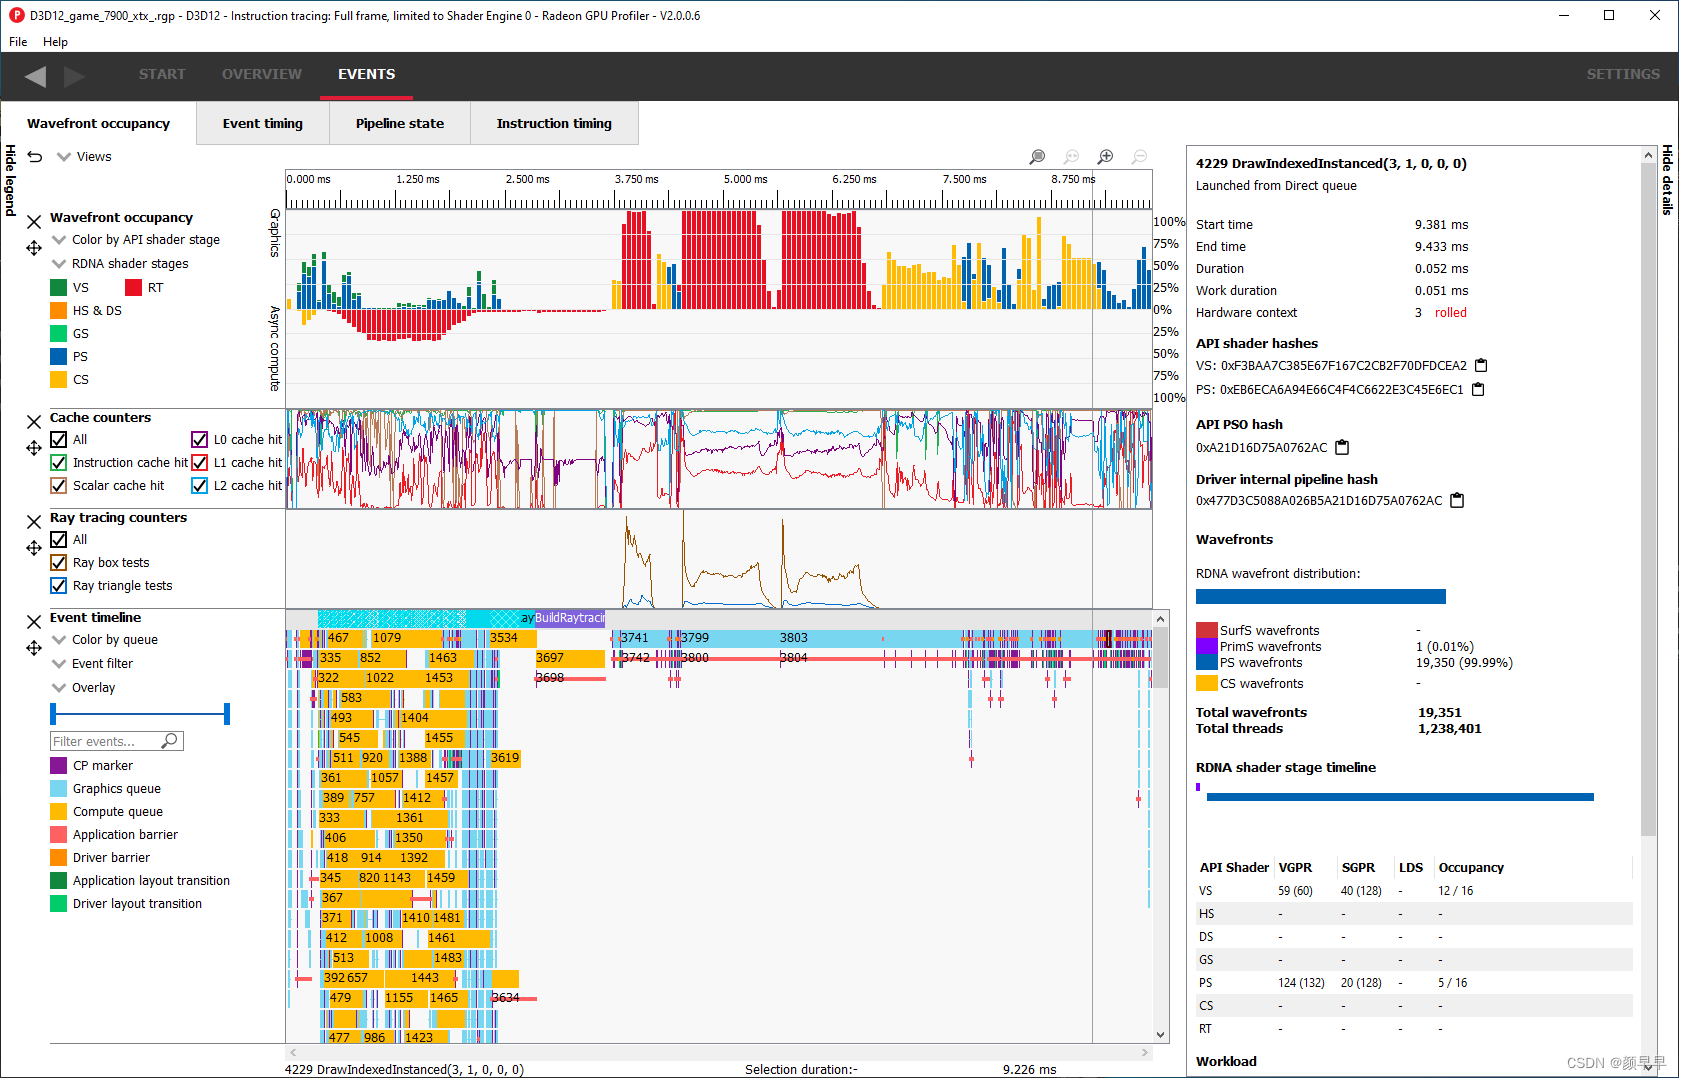
Details side panel
Pressing Hide Details on the top right will hide the side panel with more in-depth information. The contents of this panel will change, depending on what the user last selected. If a single event was selected in the Events timeline the details side panel will look like below:
在右上角按下“Hide Details ”将隐藏显示详细信息的侧边栏。该面板的内容会根据用户最后选择的内容而变化。如果在Events timeline上选择了单个事件,详细信息侧边栏将如下所示:
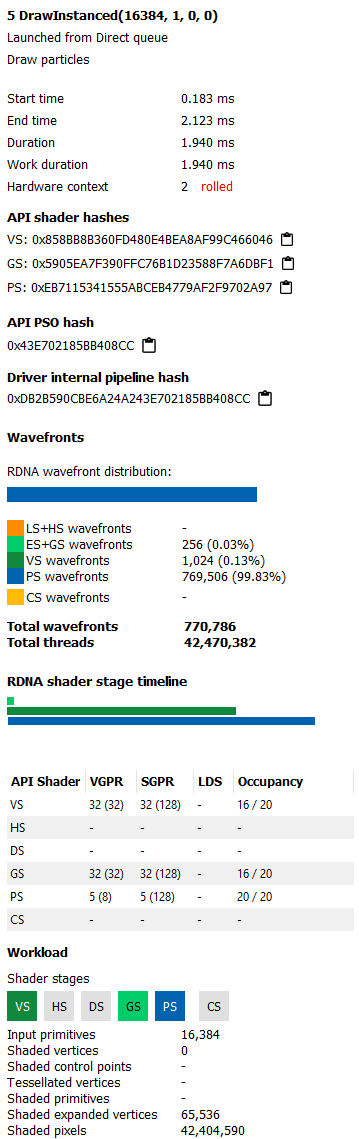
The Details side panel for a single event contains the following data:单个的事件会包含的内容如下:
-
The event’s API call name
-
The queue it was launched on
-
User event hierarchy (if present)
-
Start, End, and Duration timings
-
Hardware context and if it was rolled (context roll 的概念可以参考这篇:《AMD GPU 的 Context Roll机制》)
-
The API shader hashes for all shaders used by the event
-
The API PSO hash for the event
-
The Driver internal pipeline hash for the event
-
Colored bar showing wavefront distribution per RDNA or GCN hardware stage
-
List of RDNA or GCN hardware stages and wavefront counts
-
Total wavefront count
(备注:以上的wavefront 概念参考《AMD wavefront 介绍》)
-
Total threads
-
RDNA or GCN shader timeline graphic showing active stages and duration
-
A table showing resource usage for each API shader stage(显示每个着色器阶段资源使用情况):
-
The VGPR and SGPR columns refer to the vector and scalar general purpose registers being used, and the number of registers that have been allocated shown in parentheses.(VGPR 和 SGPR 列指的是正在使用的向量和标量通用寄存器,括号内显示已分配的寄存器数量。)
-
The LDS column refers to the amount of Local Data Store that each shader stage is using, reported in bytes.(LDS 列指的是每个着色器阶段使用的本地数据存储量,以字节为单位统计。)
-
The Occupancy column refers to the Theoretical wavefront occupancy for the shader. This is reported ‘A / B’, where A is the number of wavefronts that can be run and ‘B’ is the maximum number of wavefronts supported by the hardware.(占用率列指的是着色器的理论波前占用率。这以“A / B”形式报告,其中 A 是可以运行的波前数量,“B”是硬件支持的最大波前数量)
-
Tooltips explaining the data are available by hovering the mouse over the table header.(鼠标悬停在表头上会显示解释数据的工具提示)
-
-
The API Shader Stage Control indicates which shader stages are active for the selected event.
-
Primitive, vertex, control point, and pixel counts
The ‘Duration’ shows the time from the start of the first shader to the end of the last shader, including any space between shaders where no actual work is done (denoted by a line connecting the shader ‘blocks’). The ‘Work duration’ only shows the time when the shaders are actually doing work. This is the sum of all the shader blocks, ignoring the connecting lines where no work is being done. If there is overlap between shaders, the overlap time is only accounted for once. If all shaders are overlapping, then the duration will be the same as the work duration.
“Duration”显示的是从第一个着色器开始到最后一个着色器结束的持续时间,包括着色器之间那些没有实际工作的时间(用连接不同着色器blocks之间的线条表示)。而“Work duration”仅显示着色器实际进行工作的时间,也就是统计的是所有着色器工作时间的总和,忽略没有工作在进行的那些连接线。如果着色器之间有重叠,重叠时间只计算一次。如果所有着色器都重叠,那么Duration和Work duration就是一样的。
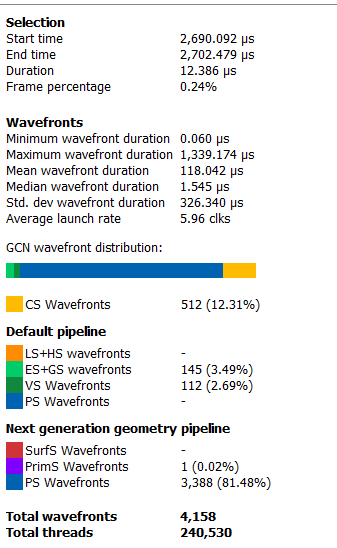
If the user selects a range by clicking and dragging the mouse, the details side panel shows a summary of all the wavefront data contained in the selected region as shown below
如果用户通过点击并拖动鼠标选择了一个范围,详细信息侧边栏将显示所选区域内的所有wavefront数据的摘要,如下所示:
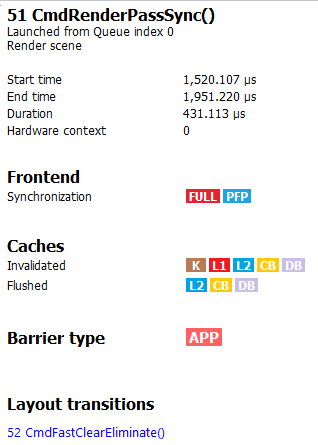
If the user selects a barrier,the details side panel will show information relating to the barrier, such as the barrier flags and any layout transitions associated with this barrier. It will also show the barrier type (whether it came from the application or the driver). Note that the barrier type is dependent on whether the video driver has support for this feature. If not, then it will be indicated as ‘N/A’. An example of a user-inserted barrier is shown below:
如果选中的是一个barrier,那么side panel显示的信息就是barrier的信息,比如说barrier flags,或者是相关的layout transitions,也会显示 barrier type(是driver产生的还是应用产生的)。注意,barrier type 还要看显卡驱动是不是支持这个feature,如果不支持,就会显示‘N/A’。以下这张图是一个用户插入的barrier的例子:
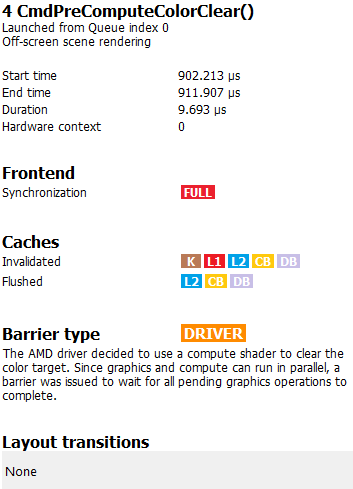
If the driver needed to insert a barrier, a detailed reason why this barrier was inserted is also displayed, as shown below:
如果是驱动添加的barrier,还会有关于为什么需要这个barrier的描述,如下图:
If the user selects a layout transition,the details side panel will show information relating to the layout transition as shown below:
如果用户选中的是layout transition,side panel展示的则是跟layout transition相关的信息:
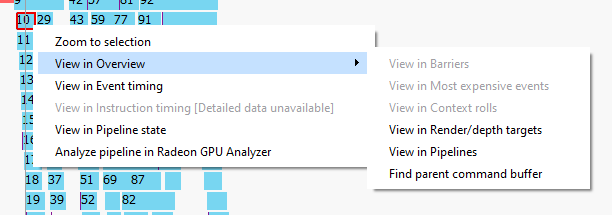
The user can also right-click on any event or overlay in the Events timeline view and navigate to the Event timing, Pipeline state, or Instruction timing pane, or to one of the panes in the Overview tab. The selected event or overlay will be shown in the chosen view.
In addition, the user can zoom into an event using the “Zoom to selection” option from this context menu.
Below is a screenshot of what the right-click context menu looks like.
Wavefront occupancy
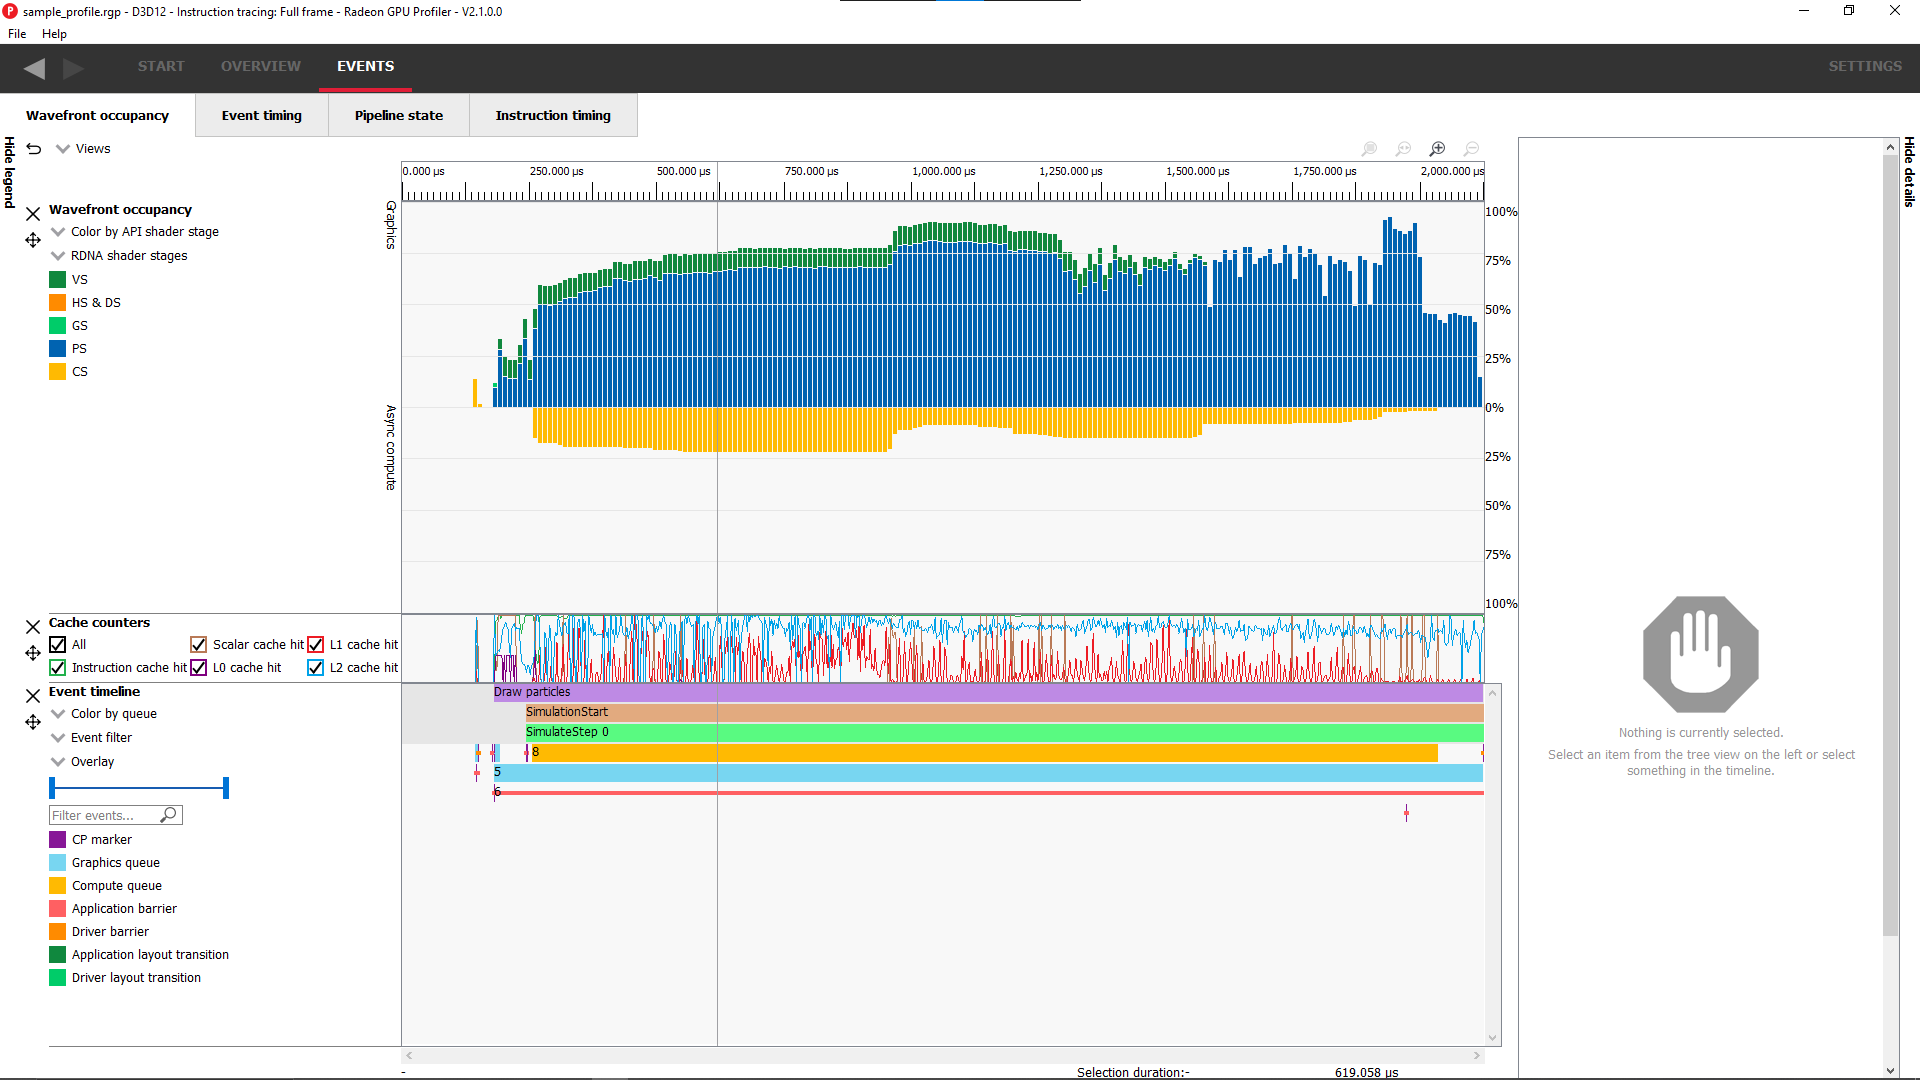
The Wavefront occupancy section of RGP is customizable. Users can hide and reorder the vertical position of views. Users can also resize the height of the views.
To hide a view, simply press the X button next to the view.
RGP的波前占用率部分支持自定义。用户可以隐藏视图并调整其垂直排列顺序,也可调整视图的高度。
若要隐藏某个视图,只需点击该视图旁的X按钮。
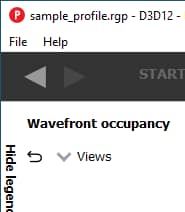
To show a hidden view, use the Views combo box in the top left of the tab.
要显示已隐藏的视图,请使用选项卡左上角的“视图组合框”(Views combo box)。
The Views combo box can also be used to hide views.
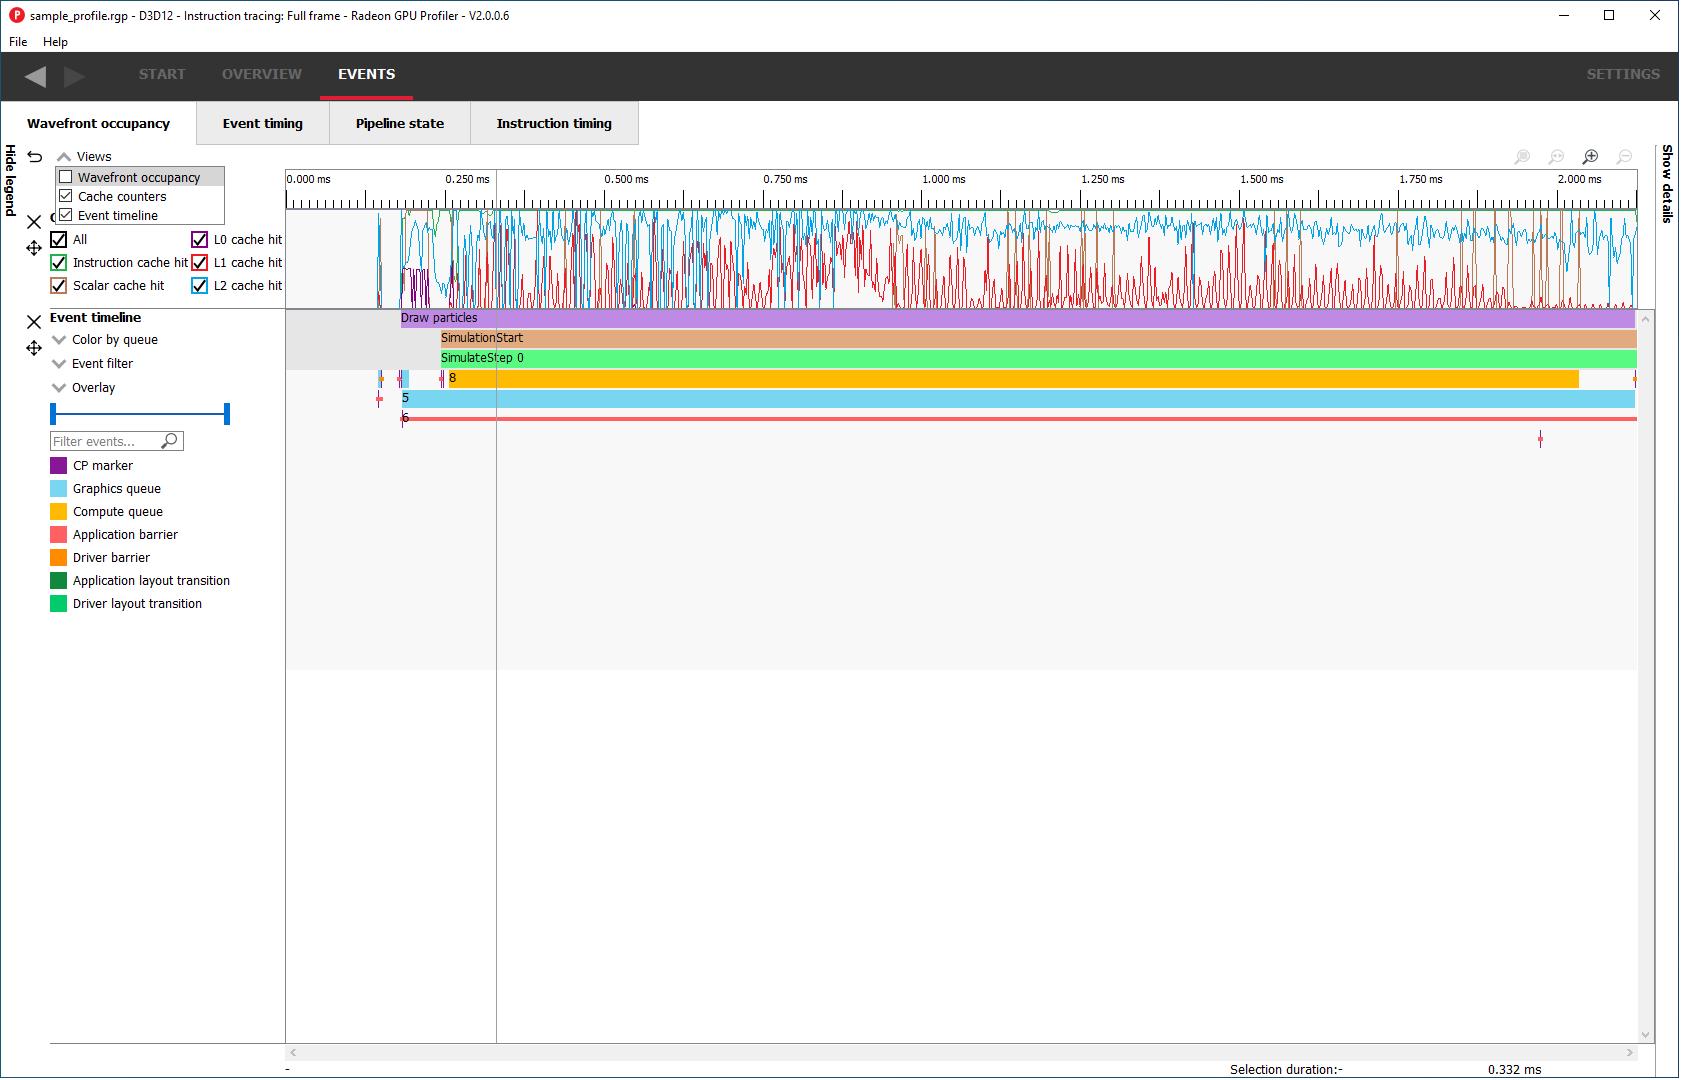
To reorder a view’s vertical position within the tab, you can drag the view you want to reorder and drop it into a new position.
To do this, move the mouse above the drag button next to the view you want to move. A dashed blue rectangle will appear around the view to indicate which view will be dragged.
“ Views”选择框也可用于隐藏视图。
若要调整视图中某一项的垂直位置,可拖动目标视图并将其放置到新位置。
操作时,将鼠标悬停于目标视图旁的“drag button”(一个十字形状的拖动按钮)上方,此时视图周围会出现蓝色虚线框,表示该视图可被拖动。
Press, and hold, the drag button. A solid blue line will appear to indicate what the new position of the view will be after letting go of the mouse.
按住拖动按钮后,会出现一条蓝色实线,指示松开鼠标时视图将移动到的目标位置。
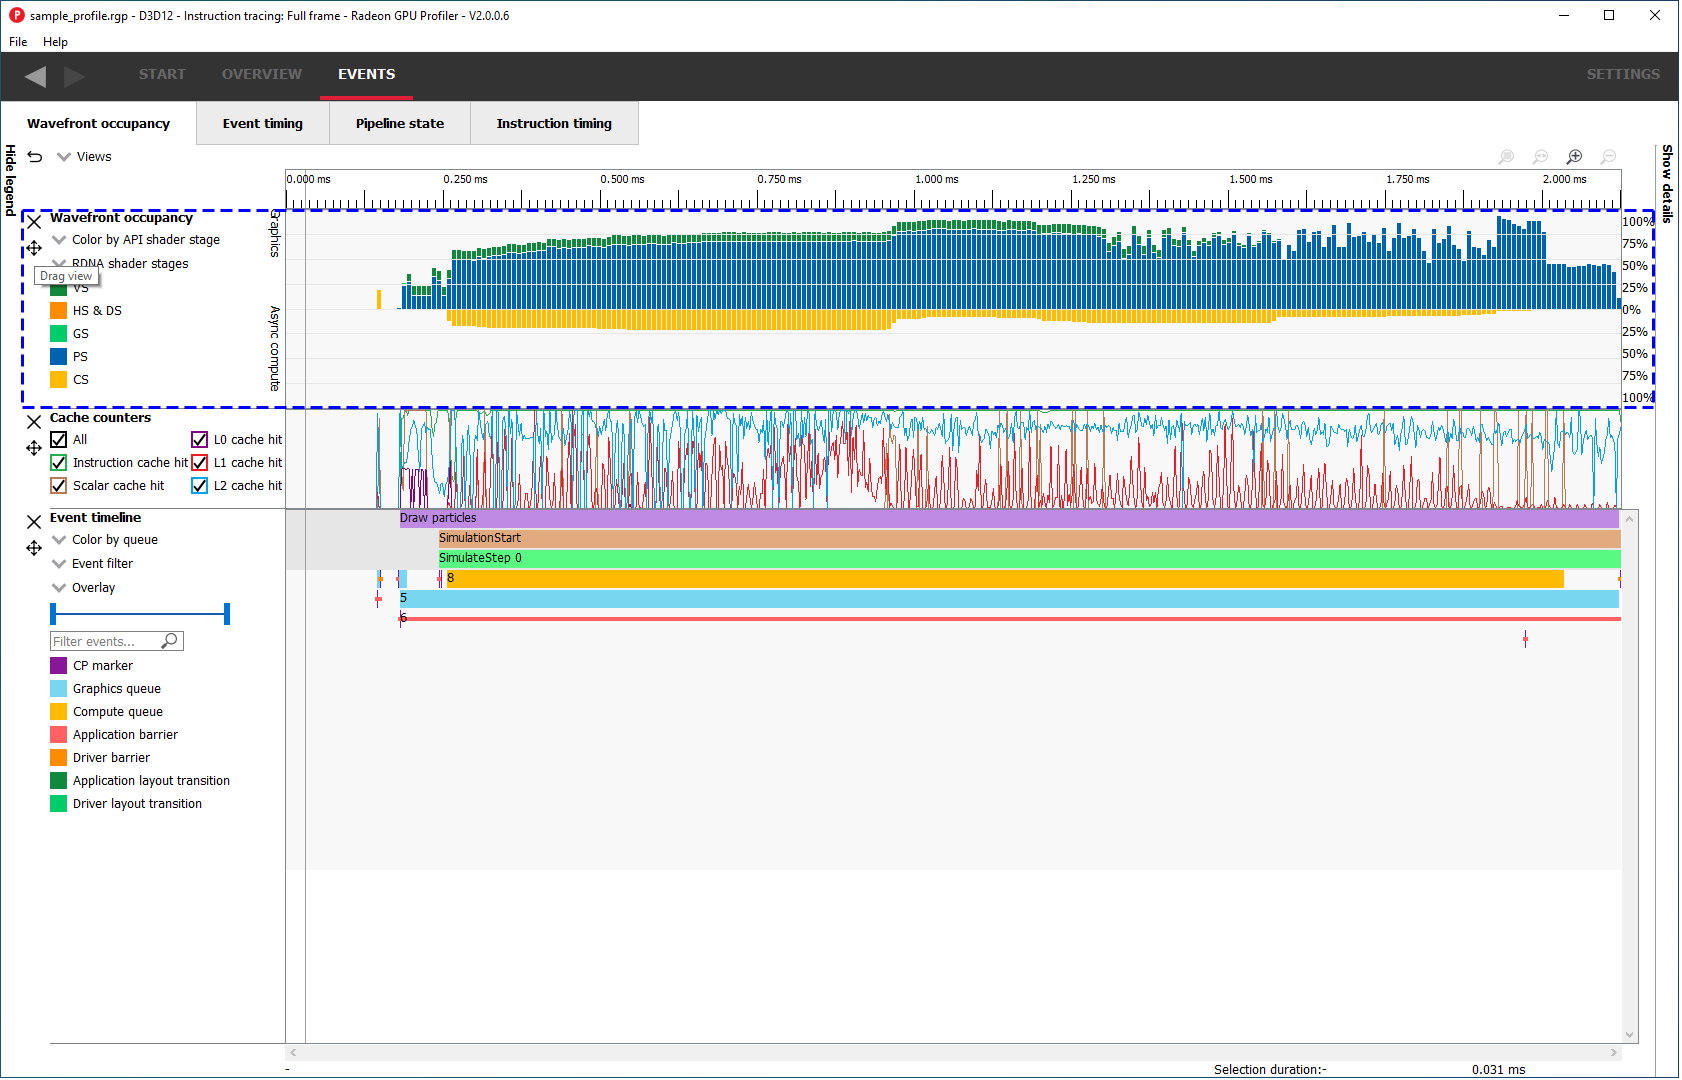
The view will be dropped into its new position and remain there until you move it again. The Views combo box will be updated to reflect its new position.
视图将被放置到新位置,并保持该位置直至再次移动。同时,“视图组合框”中的顺序会同步更新。
The views can also be resized by clicking and dragging the bottom of the view.
还可通过点击并拖动视图底部来调整其高度。
The customization of the Wavefront occupancy section is treated like a normal RGP setting and persists upon closing and reopening RGP.
To return the Wavefront occupancy customization to its original state, press the Restore to default button in the top left of the tab.
Wavefront occupancy自定义设置与常规RGP设置相同,重启RGP后仍然是有效的。
若要将 Wavefront occupancy自定义恢复为原始状态,请点击选项卡左上角的“恢复默认”(Restore to default)按钮。
Note that the visibility state of the legends side panel is also saved.
注意:图例侧面板(legends side panel)的可见性状态也会被保存。
Event timing
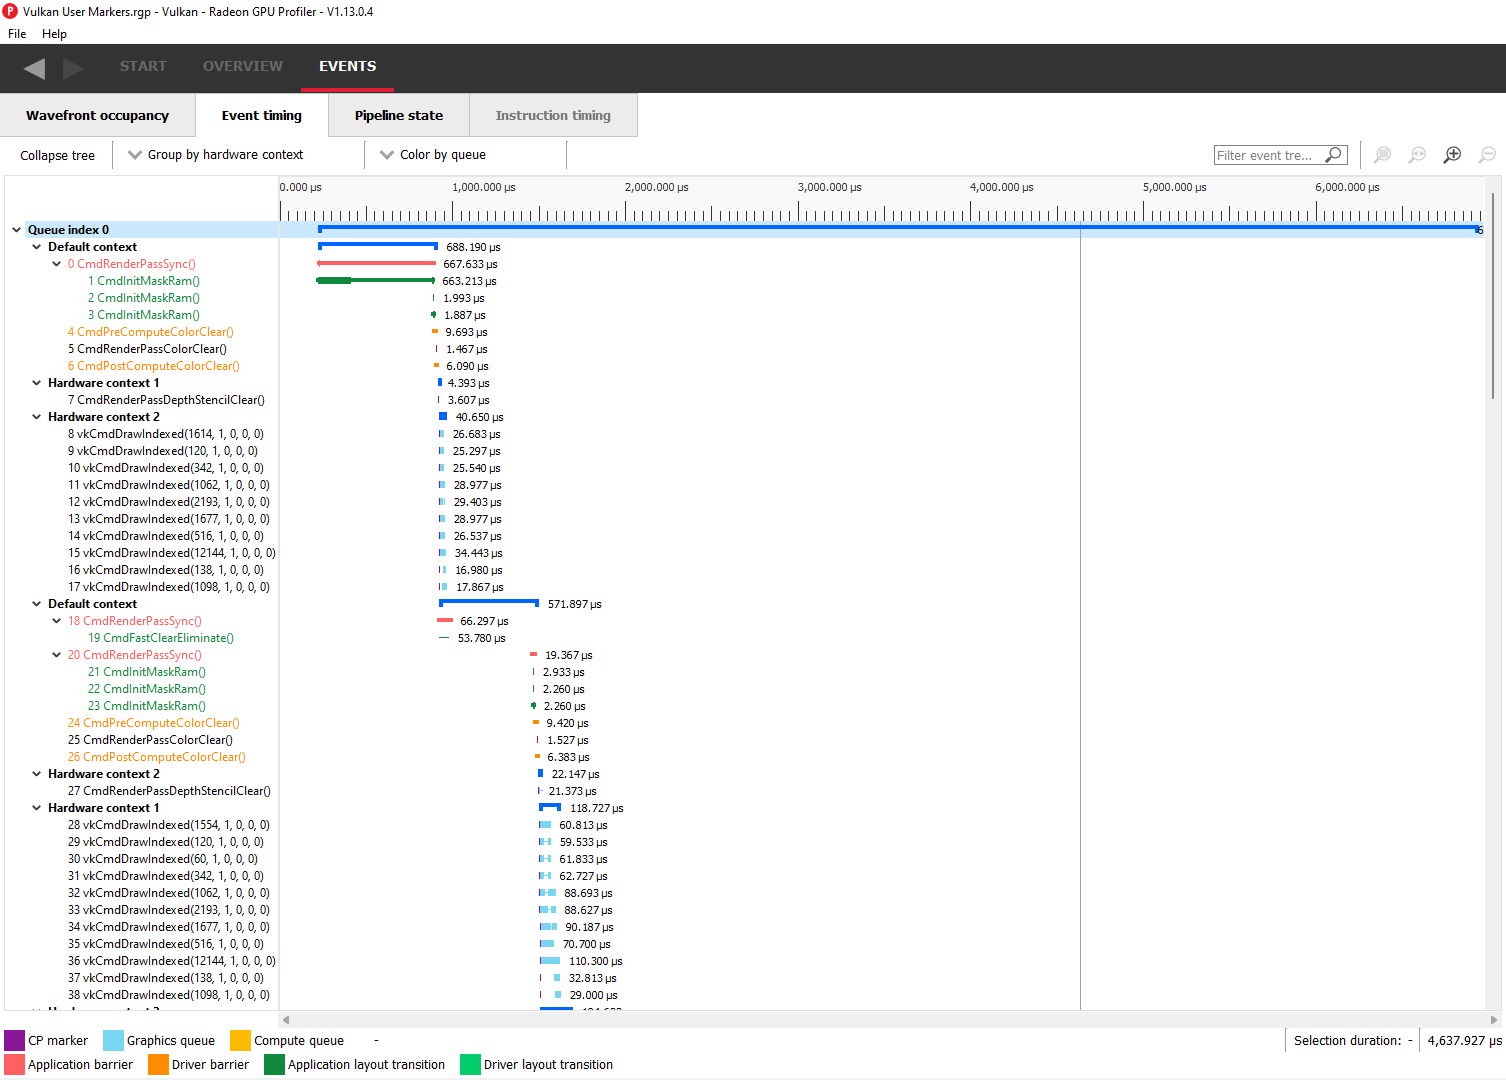
The event timing window shows a list of events and their corresponding timings. The tree view in the left-hand column shows each event name and its unique index, starting at 0, and are listed in sequential order. Events can be ordered into groups, and group categories are shown in bold text.
事件计时窗口会显示事件列表及其对应的时间数据。左侧列的树形视图按顺序列出每个事件的名称及其唯一索引(从0开始)。事件可被分组,分组类别会加粗显示。
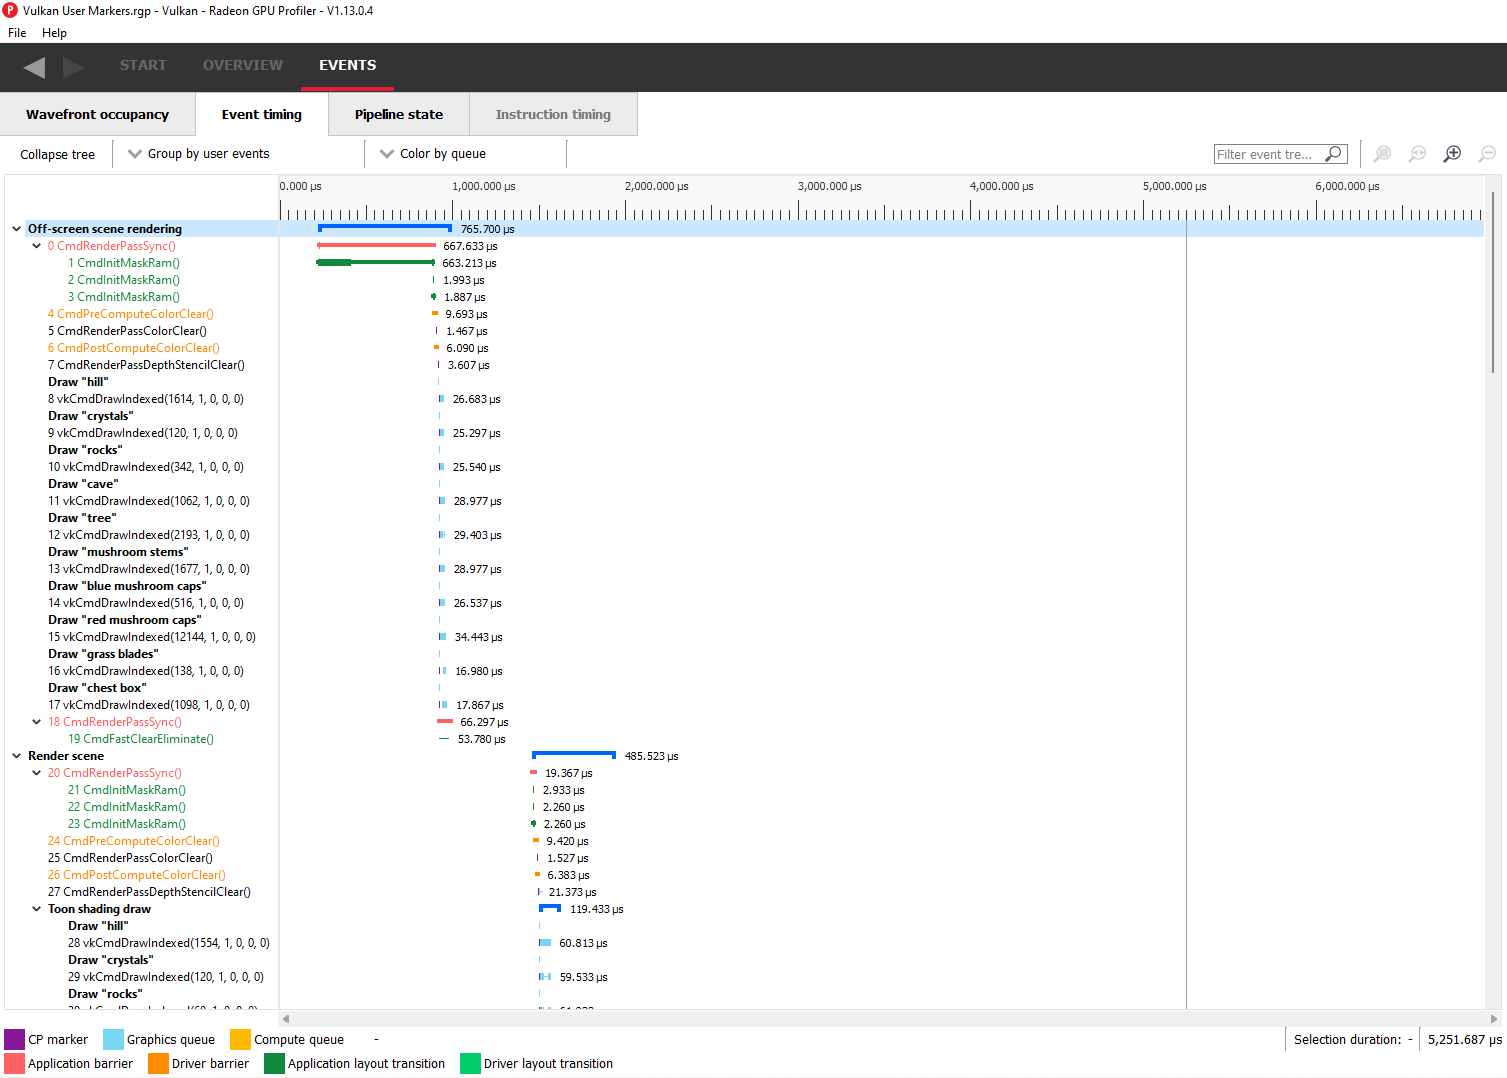
The pane to the right of the tree view shows a graphical representation of the duration for each event. The darker blue span to the right of each tree node shows the duration of all the events in that node.
In the graphic for each event (shown in light blue above) the first small block at the left is the CP marker, indicating when the event was issued. This is followed, some time later, by actual work done by the shaders. The delay between the CP marker and the start of actual work may indicate bottlenecks in the application. One of the shaders may be waiting for a resource which is currently being used by another wave in flight and cannot start until it obtains that resource.
The time when the first shader started work and the last shader finished work is the number indicated in this column. Each shader stage is represented by a rectangular block. The longer the block, the longer the shader took to execute. Shaders are linked by a solid line to show that they are connected in the pipeline. For groups, a dark line spans all events within the group, showing the time taken for that group to complete work.
Zoom settings on this pane are similar to the Wavefront occupancy pane. More information can be found under the Zoom Controls section.
右侧窗格以图形化方式展示每个事件的duration(持续时间)。每个树节点右侧的深蓝色区域表示该节点下所有事件的总持续时间。
每个事件的图形(上方以浅蓝色显示)中,左侧第一个小块为**CP标记(CP marker)**,表示事件被提交的时间点;随后(间隔一段时间)是着色器实际执行的工作。CP标记与实际工作开始之间的延迟可能表明应用程序存在瓶颈(例如某个着色器正在等待被其他运行中的wave占用的资源)。
此列中显示的数字是第一个着色器开始到最后一个着色器结束的总时间。每个着色器阶段以矩形块表示,块越长表示执行时间越长。着色器之间通过实线连接,表示它们在管线中的关联性。对于分组事件,一条深色横线会覆盖组内所有事件,显示该组完成工作的总耗时。
此窗格的缩放设置与波前占用率(Wavefront Occupancy)窗格类似,详细信息请参阅 Zoom Controls 章节。
Grouping modes
The events can be grouped together. Normally these groups don’t affect the event ordering but sometimes can (sort by state bucket).
Group by pass will show events depending on the render target or attachment type (color, depth-only, compute, raytrace).
Group by hardware context will group events by their hardware context, making it easy to see which events caused the context to change.
Group by state bucket (unsorted) will order the events by state bucket but won’t sort the state buckets by duration. Theoretically, all events in a state bucket use the same shaders. The duration of a state bucket is represented by the dark blue line corresponding to the state bucket group text.
Group by state bucket (serialized) will take all the event timings within the group and sum the total time that the shaders were busy, ignoring all empty space between events. This has the effect of serializing the shader work and doesn’t take into account that some shaders will be executing in parallel. This is used to highlight when you have a lot of small shaders whose cumulative work can be extensive. As an example, if you have 2 shaders which start at the same time and one takes 2000 clks and another takes 10000 clks, the total duration would be 12000 clks.
Group by state bucket (overlapped) takes into account the parallelism of the shader execution so will highlight shaders which take a long time to execute. Using the same example above, since both shaders start together, the total duration in this case would be 10000 clks.
Group by command buffer will group events depending on which command buffer they are on.
Group by user events will group the events depending on which user event(s) they are surrounded by.
Group by PSO will group events by their API PSO hash values.
事件可通过多种方式分组。通常分组不会影响事件顺序,但某些模式下可能会(例如按状态桶排序)。
- Group by pass(按渲染过程分组):根据render target或附件类型(颜色、深度、计算、光线追踪)显示事件。
- Group by hardware context(按硬件上下文分组):便于观察引发context切换的事件。
- Group by state bucket (unsorted)(按状态桶分组(未排序)):按state bucket 排列事件,但不按耗时排序state bucket 。理论上,同一state bucket 内的事件使用相同着色器。state bucket 的总耗时由对应深蓝色横线表示。
- Group by state bucket (serialized))(按状态桶分组(串行化):累加组内所有事件的着色器工作时间(忽略事件间空闲时间),相当于将所有着色器工作串行化。此模式用于突显多个短耗时着色器的累积影响(例如:两个同时启动的着色器分别耗时2000和10000时钟周期,总耗时为12000)。
- Group by state bucket (overlapped)(按状态桶分组(并行化)):考虑着色器并行执行,突显耗时长的着色器。沿用上例,总耗时为10000时钟周期(取两者最大值)。
- Group by command buffer(按命令缓冲区分组):按事件所属的命令缓冲区分组。
- Group by user events(按用户事件分组):按事件周围的用户事件分组。
- Group by PSO(按PSO分组):按API PSO哈希值分组。
The default grouping mode is by user event if user events are present in the profile. Otherwise the default will be to group by pass.
Note that grouping by hardware context or command buffer will group events by queue first. Grouping by pass or user event will chronologically group events irrespective of which queue they originated from. Grouping by state bucket just shows events in the graphics queue. Grouping by hardware context is shown below:
默认分组模式:若分析数据包含用户事件,则按用户事件分组;否则按渲染过程分组。
注意:
按hardware context或command buffer分组时,会先按队列(queue)分组。
按pass或user events分组时,事件按时间顺序排列,忽略事件是从哪个queue来的。
按state bucket 仅显示graphic队列中的事件。
硬件上下文分组示例如下:
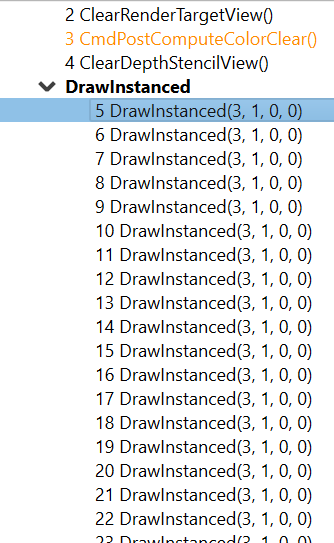
Note that when profiling an application that uses indirect drawing via the ExecuteIndirect D3D12 call, the event tree view will logically group the individual draw calls under the same parent node. This can be seen below where the individidual DrawInstanced events are grouped under a parent node with the same name:
当分析使用D3D12的`ExecuteIndirect`调用进行间接绘制的应用程序时,事件树形视图会将多个绘制调用逻辑归类到同一父节点下。例如下图中,多个`DrawInstanced`事件被归入同名父节点:
Color modes
The events can be rendered using different color schemes in the same manner as in the Wavefront occupancy view.
The user can also right-click on any of the events and navigate to Wavefront occupancy or Pipeline state panes, as well as Barriers, Most expensive events and Context rolls panes within the Overview tab, and view the selected event in these panes, as well as in the side panels.
事件的着色方案与Wavefront occupancy视图相同。用户可右键点击任意事件,跳转到Wavefront occupancy视图、Pipeline state窗格,或Overview 选项卡中的Barriers、Most expensive events及Context rolls窗格,并在这些视图或侧面板中查看选中事件。
Wavefront occupancy and event timing window synchronization
Zooming of the time scale and horizontal panning of the Wavefront occupancy view and Event timing view can be synchronized or adjusted independently. More information on synchronization can be found under the Zoom Synchronization heading
Wavefront occupancy 视图和Event timing 视图的时间轴缩放与水平平移可同步或独立调整。同步功能的详细信息请参阅 Zoom Synchronization heading(缩放同步(Zoom Synchronization)章节。
The anatomy of an event 事件的组成结构解析
Two examples of typical draw call events are shown below
两个典型 draw call事件的示例:

![]()
A shows the CP marker. This is the point the command processor in the GPU issues work to be done. It is then queued up until the GPU can process the workload.
B shows the work being done by the various shader stages. The gap between the CP marker and the start of B indicates that the GPU didn’t start on the workload straight away and was busy doing other things, for example, previous draw calls.
C shows any fixed-function work that needs doing after the shaders have finished executing. This occurs when a draw call is doing depth-only rendering. The fixed function work shown is the primitive assembly and scan conversion of the vertices shaded by the vertex shader.
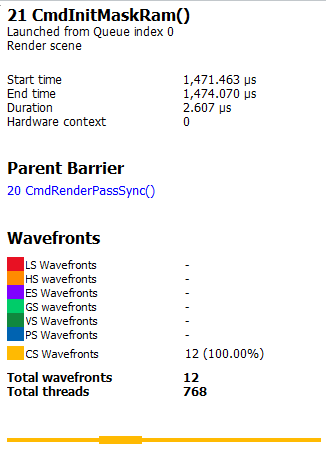
Users may also obtain information about an event’s parent command buffer by right-clicking on an event. This will bring up a context menu which contains a menu item to find the event’s parent command buffer. Selecting this menu item will navigate to the Frame summary pane and set focus on the selected event’s parent command buffer. Once here, users can obtain valuable system-level insight about the surrounding context for the event in question.
Compute dispatches have a simpler structure. A sample compute event is shown below.
A : CP 标记。这是 GPU 中命令处理器发出工作的点。在这之后任务会开始排队,直到 GPU 可以处理这些workload。(CP是“Command Processor”的缩写,CP 标记点指的是GPU中的一个特定点,在这个点上,命令处理器(CP)发出需要执行的工作指令。它标识了绘制调用的开始,之后的工作会被排队等待GPU处理。)
B :各个着色器阶段正在进行的工作。CP 标记与 B 开始之间的间隔表示 GPU 并没有立即开始处理workload,而是忙于处理之前的任务,比如其他的绘制调用。
C :在着色器执行完成后,有可能要进行的一些fixed function work,做depth-only渲染的时候会出现,图里所涉及的fixed function work是primitive assembly和scan conversion。
(笔记1:fixed function work:指的是GPU pipline中不可编程部分,比如图元组装/光栅化/深度测试。primitive assembly:图元组装,也就是把顶点连接成集合形状。scan conversion:扫描转换,也称光栅化,将图元映射到屏幕像素生成fragment。)
(笔记2:虽然depth-only渲染会跳过pixel shader阶段,但仍需要经历一些不可编程阶段,同时如果处于精度考虑,程序员用更高密度的几何做depth-only,就会显著增加depth-only的不可编程阶段的压力,因为有大量细小的三角形的去做光栅化等等。这可能是depth-only的C可能会比较长,成为性能瓶颈的原因。)
用户还可以通过右键单击事件获取事件的父命令缓冲区的信息。右键会弹出一个上下文菜单,其中包含查找事件父命令缓冲区的菜单项。选择此菜单项将导航到Frame summary 窗格,并聚焦于所选事件的父命令缓冲区。在这里,用户可以获得有关该事件相关上下文的有价值的系统级洞察。
计算调度的结构更简单。下面显示了一个示例计算事件。
![]()
In a compute event, only compute shader waves are launched. Also, compute dispatches do not have any fixed function work after the shader work is finished.
在compute 事件中,就只启动计算着色器wave,没有任何fixed function work ,结构更简单。
第二部分:


 1346
1346

 被折叠的 条评论
为什么被折叠?
被折叠的 条评论
为什么被折叠?
 到【灌水乐园】发言


