


1.
import pandas as pd
data  = pd.read_csv('data.csv')
data.info()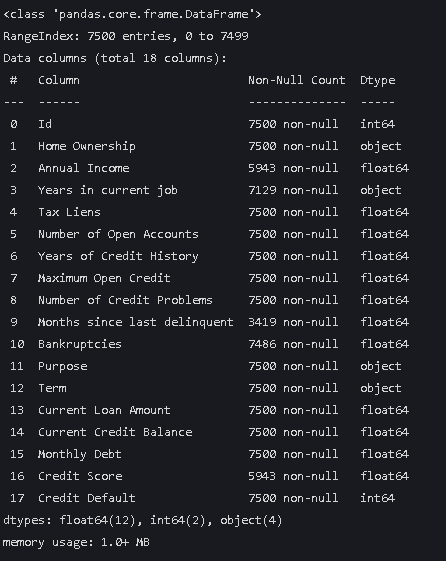
2. 查看前五行数据
data.head(5)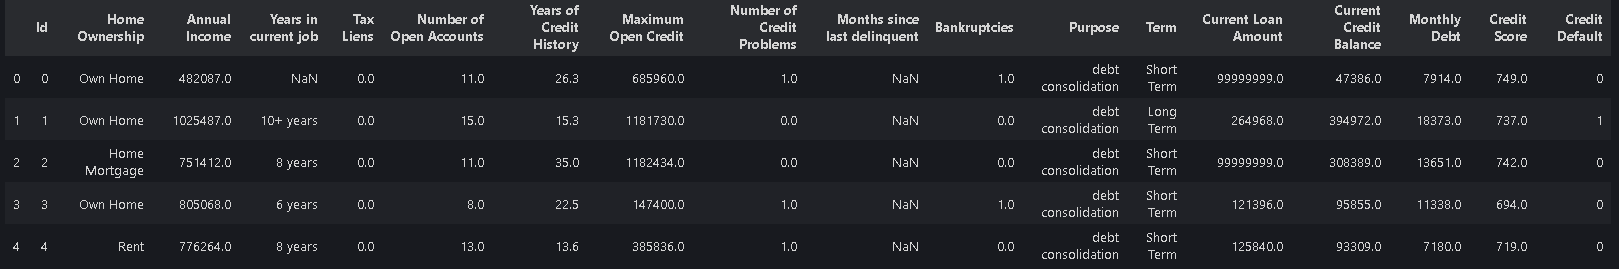
3.查看标签的内容
data["Years in current job"].value_counts()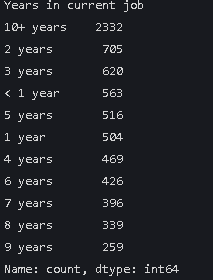
data["Home Ownership"].value_counts() 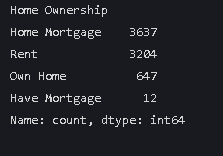
4.将上面的字符串映射为数字
mappings = {
    "Years in current job": {
        "10+ years": 10,
        "2 years": 2,
        "3 years": 3,
        "< 1 year": 0,
        "5 years": 5,
        "1 year": 1,
        "4 years": 4,
        "6 years": 6,
        "7 years": 7,
        "8 years": 8,
        "9 years": 9
    },
    "Home Ownership": {
        "Home Mortgage": 0,
        "Rent": 1,
        "Own Home": 2,
        "Have Mortgage": 3
    }
}

data["Years in current job"] = data["Years in current job"].map(mappings["Years in current job"])
data["Home Ownership"] = data["Home Ownership"].map(mappings["Home Ownership"])
data.info()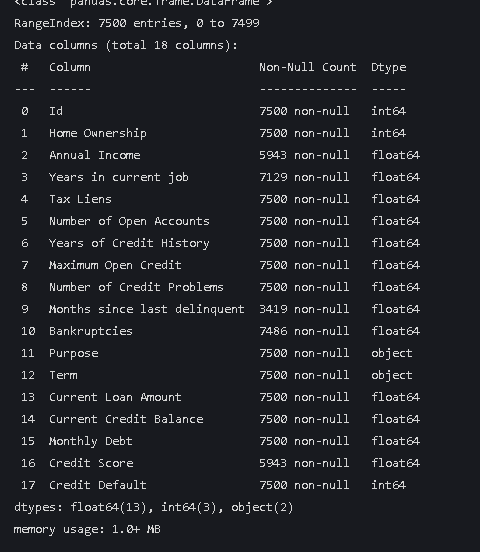
可以看到object变成了int型
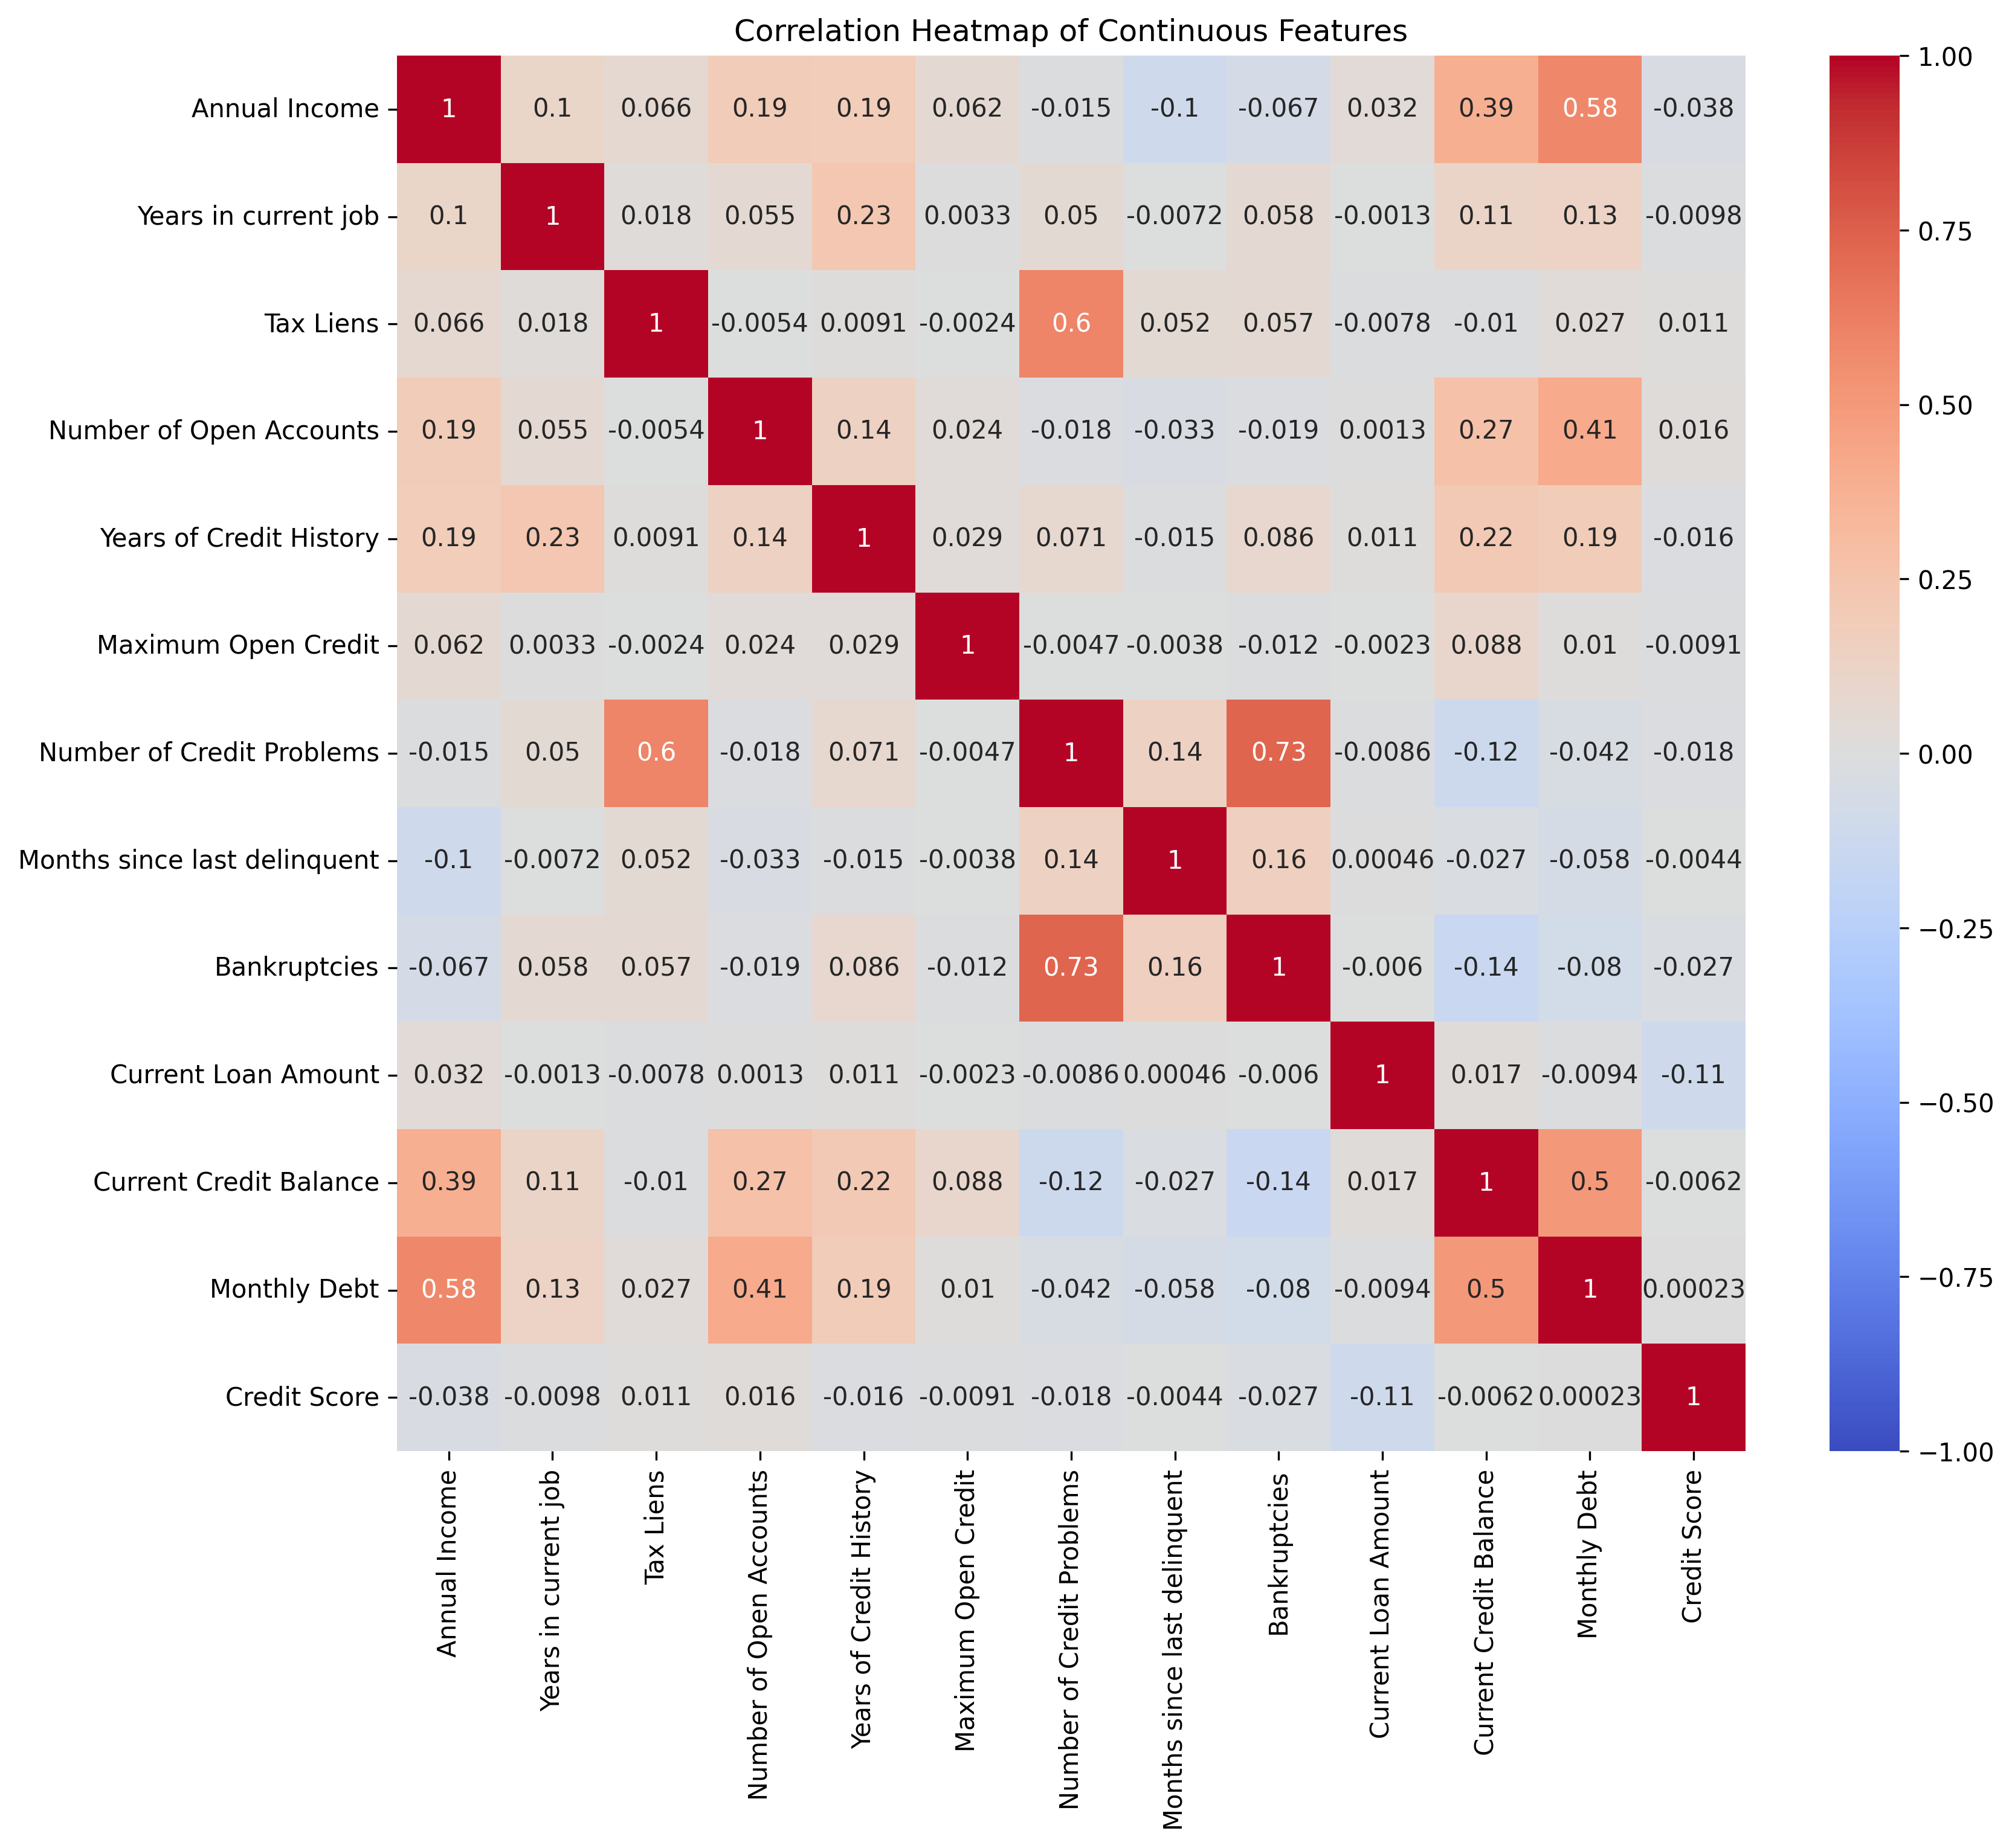
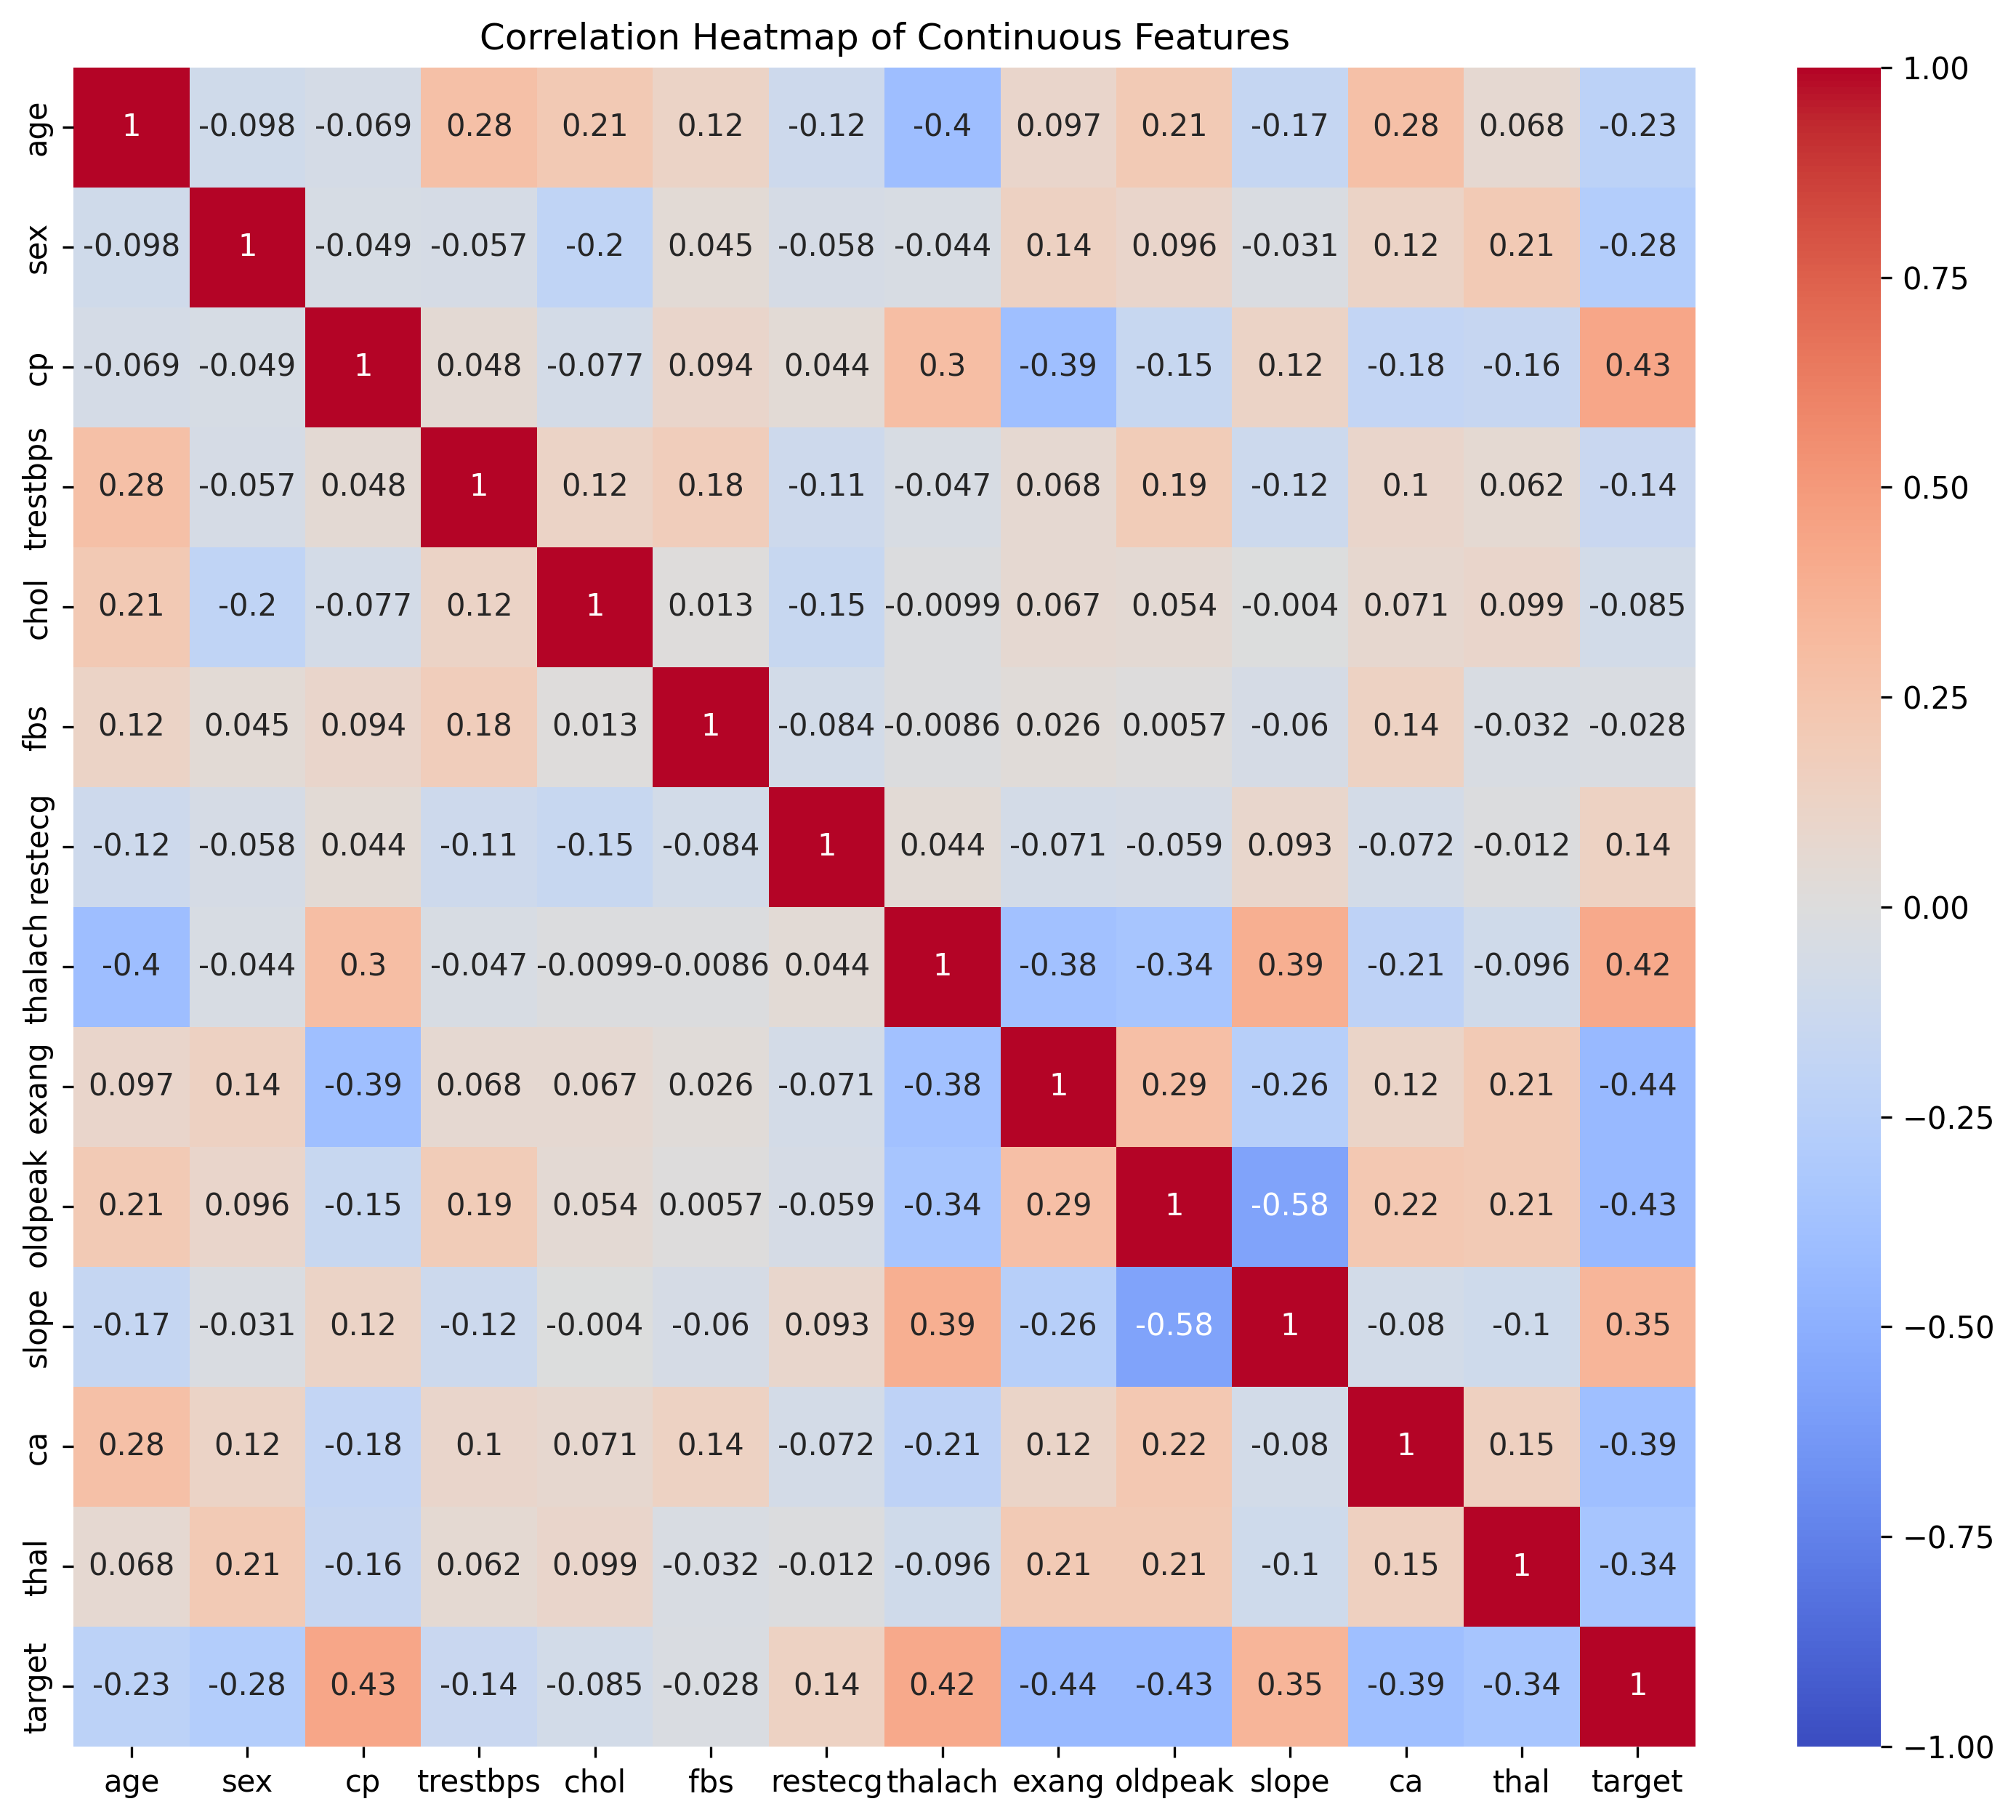
5.绘制热力图
import pandas as pd
import seaborn as sns
import matplotlib.pyplot as plt

continuous_features = [
    'Annual Income', 'Years in current job', 'Tax Liens',
    'Number of Open Accounts', 'Years of Credit History',
    'Maximum Open Credit', 'Number of Credit Problems',
    'Months since last delinquent', 'Bankruptcies',
    'Current Loan Amount', 'Current Credit Balance', 'Monthly Debt',
    'Credit Score'
] #提取连续值特征


correlation_matrix = data[continuous_features].corr() #相关系数矩阵

plt.rcParams['figure.dpi'] = 300 #设置图像分辨率

plt.figure(figsize=(12, 10))
sns.heatmap(correlation_matrix, annot=True, cmap='coolwarm', vmin=-1, vmax=1)
plt.title('Correlation Heatmap of Continuous Features')
plt.show()
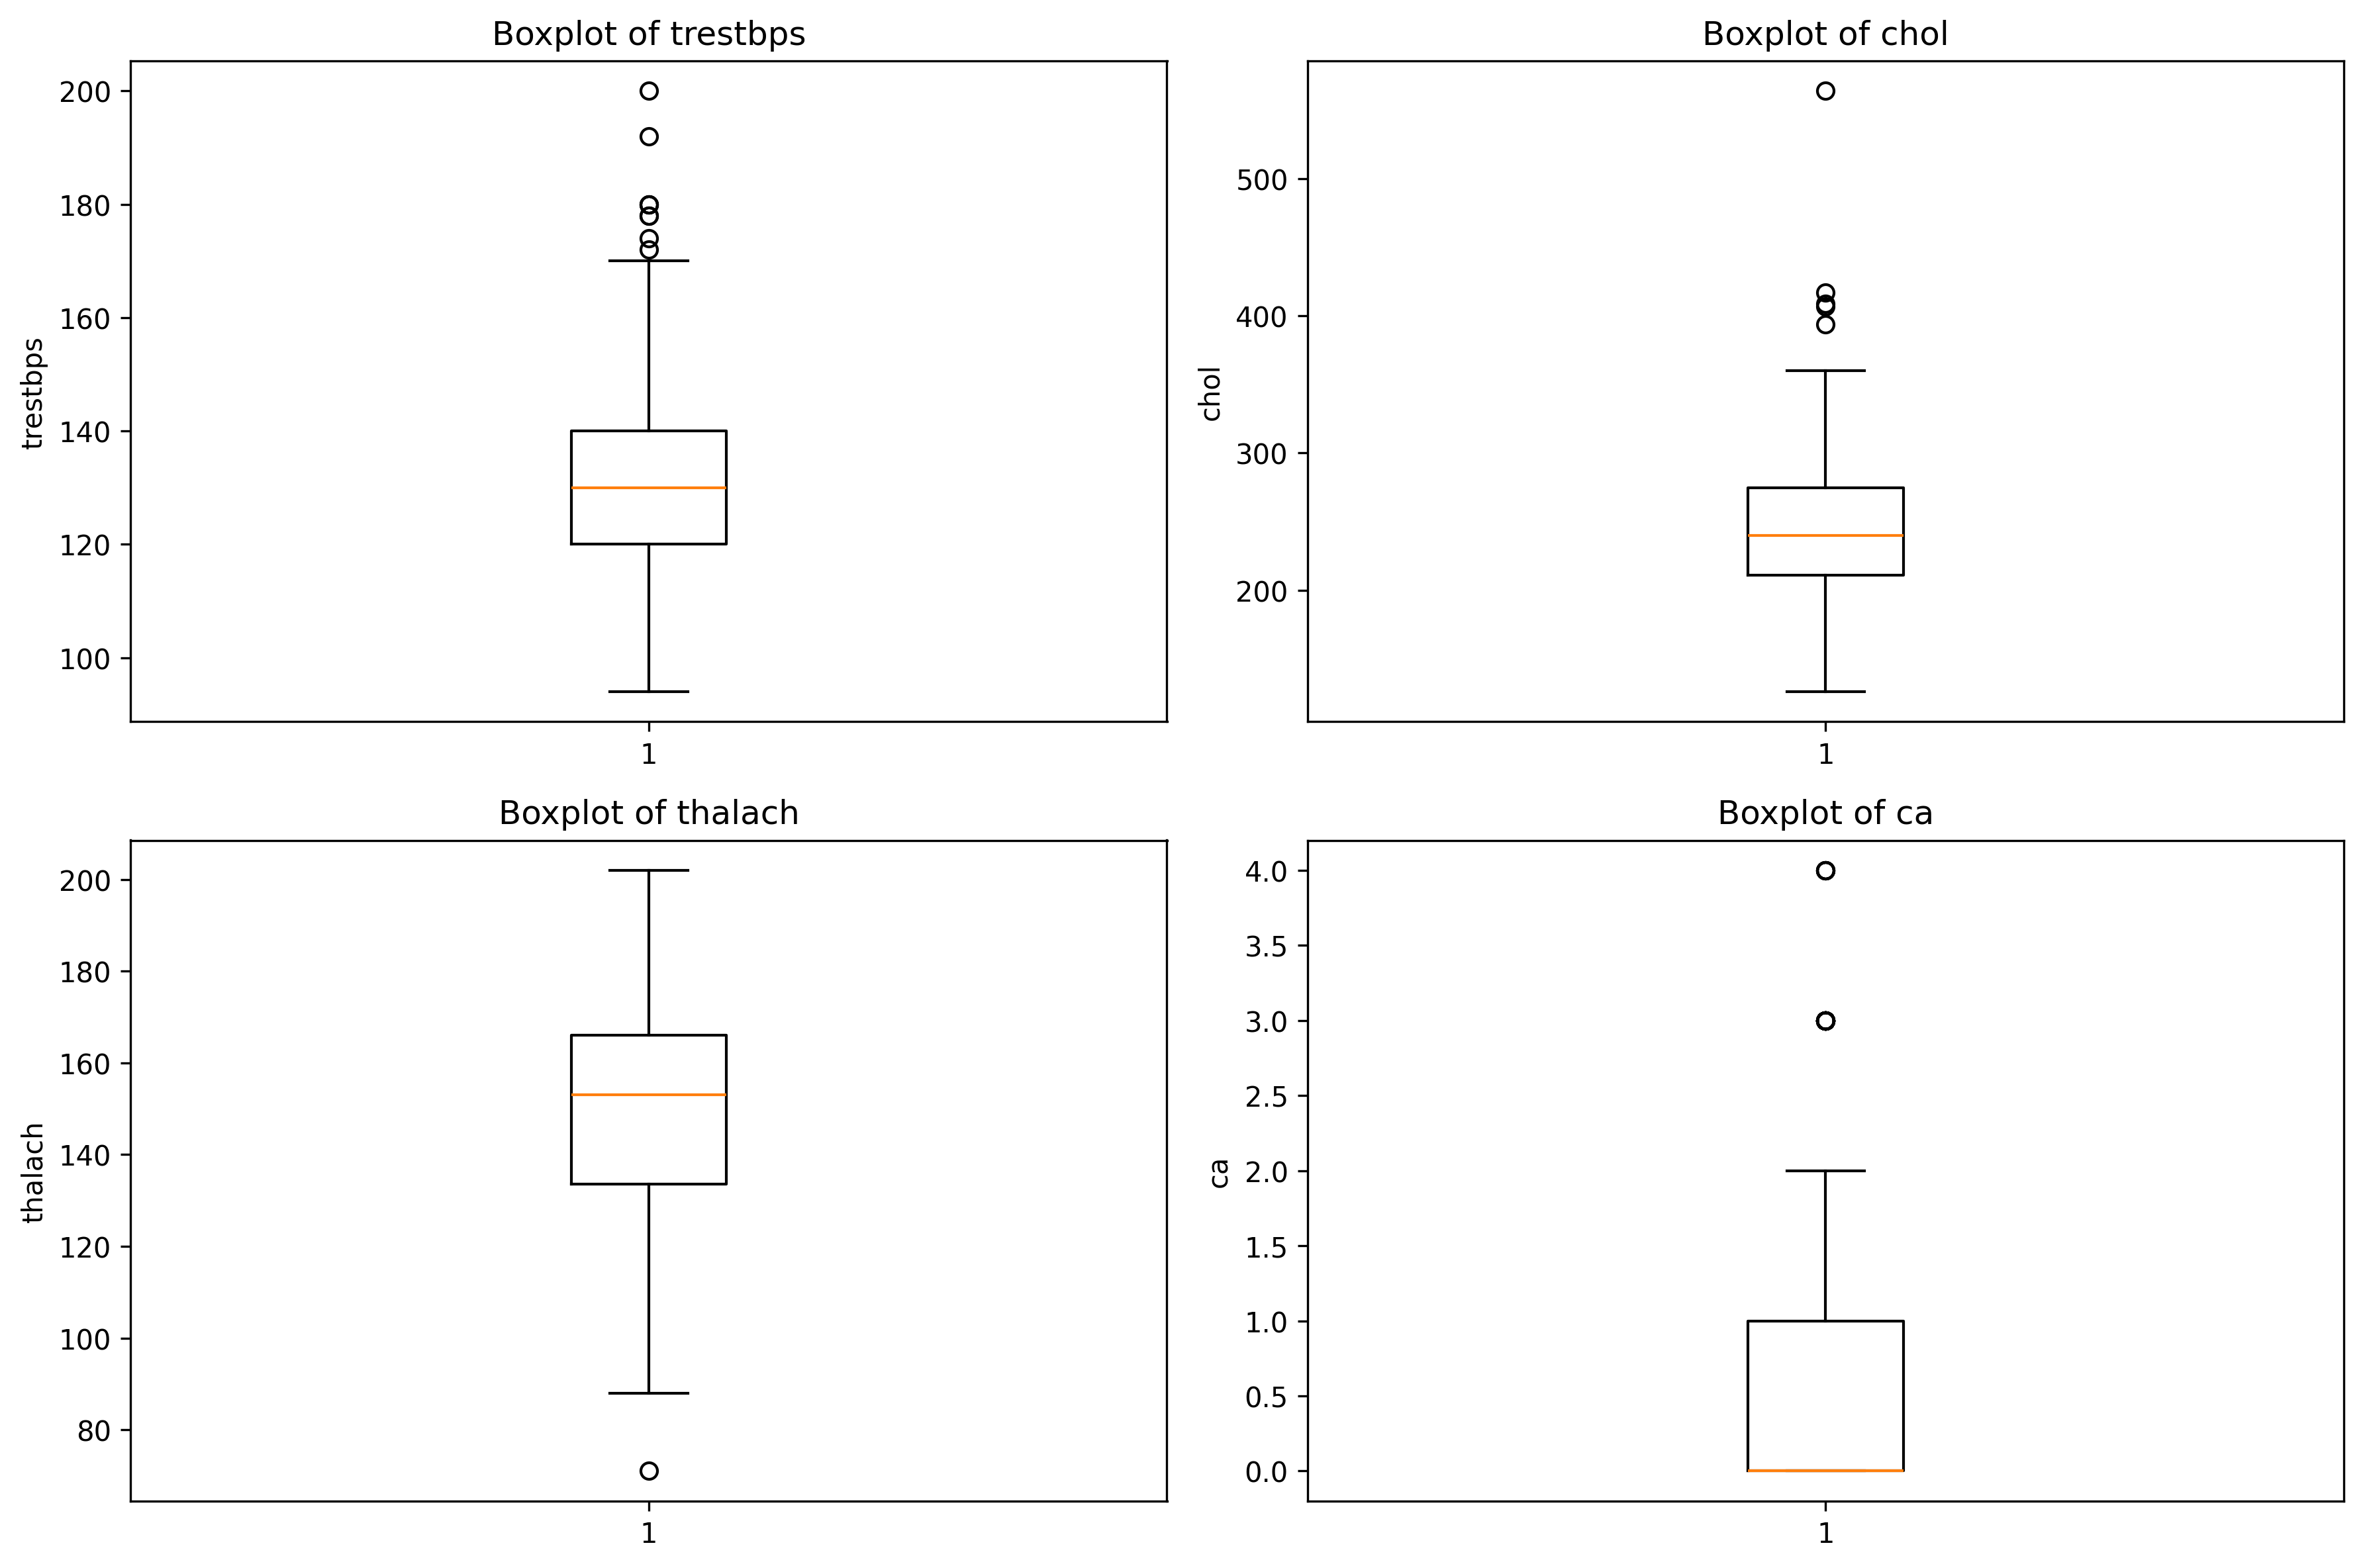
6. 以坐标的形式绘制四个特征的箱线图
import pandas as pd
import matplotlib.pyplot as plt


features = ['Annual Income', 'Years in current job', 'Tax Liens', 'Number of Open Accounts']

plt.rcParams['figure.dpi'] = 300

fig, axes = plt.subplots(2, 2, figsize=(12, 8)) #两行两列

i = 0
feature = features[i]
axes[0, 0].boxplot(data[feature].dropna())
axes[0, 0].set_title(f'Boxplot of {feature}')
axes[0, 0].set_ylabel(feature)

i = 1
feature = features[i]
axes[0, 1].boxplot(data[feature].dropna())
axes[0, 1].set_title(f'Boxplot of {feature}')
axes[0, 1].set_ylabel(feature)

i = 2
feature = features[i]
axes[1, 0].boxplot(data[feature].dropna())
axes[1, 0].set_title(f'Boxplot of {feature}')
axes[1, 0].set_ylabel(feature)

i = 3
feature = features[i]
axes[1, 1].boxplot(data[feature].dropna())
axes[1, 1].set_title(f'Boxplot of {feature}')
axes[1, 1].set_ylabel(feature)

plt.tight_layout() #调整间距

plt.show()
使用循环实现刚才的坐标形式 可以简化代码 这里row col 会从0,0 变成1,1 一个意思。
features = ['Annual Income', 'Years in current job', 'Tax Liens', 'Number of Open Accounts']

plt.rcParams['figure.dpi'] = 300

fig, axes = plt.subplots(2, 2, figsize=(12, 8))

for i in range(len(features)):
    row = i // 2 # 计算当前特征在子图中的行索引,// 是整除,即取整 ,之所以用整除是因为我们要的是行数
    # 例如 0//2=0, 1//2=0, 2//2=1, 3//2=1
    col = i % 2 # 计算当前特征在子图中的列索引,% 是取余,即取模
    # 例如 0%2=0, 1%2=1, 2%2=0, 3%2=1
    # 绘制箱线图
    feature = features[i]
    axes[row, col].boxplot(data[feature].dropna())
    axes[row, col].set_title(f'Boxplot of {feature}')
    axes[row, col].set_ylabel(feature)

plt.tight_layout()

plt.show()
7.enumerate()函数 可返回迭代对象
举例
features = ['Annual Income', 'Years in current job', 'Tax Liens', 'Number of Open Accounts']

for i, feature in enumerate(features):
    print(f"索引 {i} 对应的特征是: {feature}")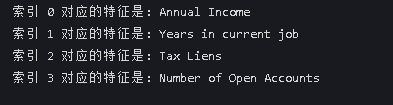
features = ['Annual Income', 'Years in current job', 'Tax Liens', 'Number of Open Accounts']
plt.rcParams['figure.dpi'] = 300
for i, feature in enumerate(features):
row = i // 2
col = i % 2
axes[row, col].boxplot(data[feature].dropna())
axes[row, col].set_title(f'Boxplot of {feature}')
axes[row, col].set_ylabel(feature)
plt.tight_layout()
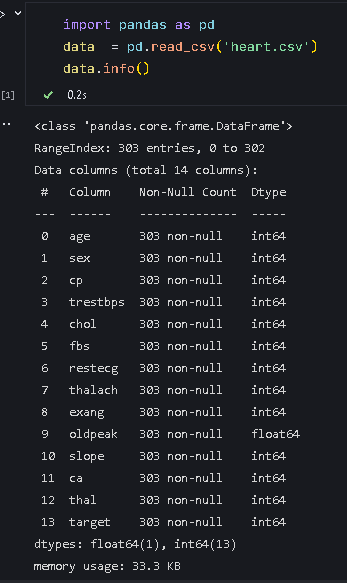
plt.show()8.作业


 1096
1096

 被折叠的 条评论
为什么被折叠?
被折叠的 条评论
为什么被折叠?
 到【灌水乐园】发言


